Taps Coogan – August 9th, 2023
Enjoy The Sounding Line? Click here to subscribe for free.
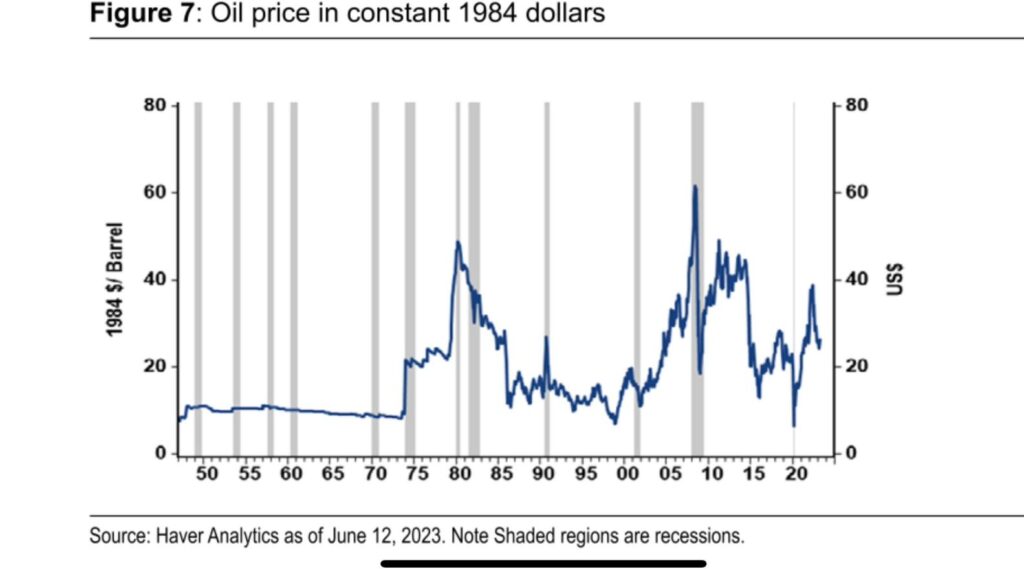
Sometimes the oil market is trading at obviously dislocated prices, like when it hit $26 a barrel in early 2016, negative $37 in 2020, or $147 during a recession in 2008.
This is not one of those times.
As the following chart via Jeroen Blokland highlights, when adjusted for inflation, oil prices are quite near their average going back to the mid-1970s:

We’ve maintained two narratives on oil in recent times. The first is that global oil and gas capex is likely not sufficient to sustain growing production in the long run, especially given that the lions share of production gains from US shale have already been reaped.

The second is that the Russian oil price-cap scheme is depressing oil prices in the short term (as intended) while leading to a pile up of OPEC production cuts that will presumably matter in the long term.
The fusion of those two narratives has been a short term expectation that oil would get pulled down and a longer term expectation that prices would need to stay high enough to reverse the OPEC cuts and incentivize sufficient capex.
The move up in crude prices over the last month from the high $60s to the low $80s may signal that there is finally insufficient cheap Russian crude for the price-cap scheme to continue depressing global prices.
However, the existence of major OPEC cuts that can be reversed, large Chinese strategic reserves, the ever-lingering threat of a recession, and the rise of electric cars, etc… should all temper bullish expectations. Basically, we think Dr. Alhajji is right.
Would you like to be notified when we publish a new article on The Sounding Line? Click here to subscribe for free.

