Submitted by Taps Coogan on the 14th of November 2017 to The Sounding Line.
Enjoy The Sounding Line? Click here to subscribe for free.
In early 2015, we published a three part series called ‘The Euro – Help or Hindrance’ (Part I, Part II, Part III), in which we evaluated the economic performance of countries inside and outside the EU and the Eurozone. In part two of the series, we asked this question:
How has the economic performance of the early Euro adopters been compared to European countries that chose to maintain their own currencies?
In order to properly answer this question, we noted:
“Adoption of the Euro currency first began in 1999 by Austria, Belgium, Finland, France, Germany, Greece, Ireland, Italy, Netherlands, Portugal, and Spain. Of the 28 members of the European Union, others have gone on to adopt the Euro currency at later dates.
In contrast, some countries in the E.U. have chosen to maintain their own national currencies. These countries are Bulgaria, Czech Republic, Denmark, Hungary, Poland, Romania, Sweden, and the United Kingdom.
It should be noted that Denmark nominally maintains its own currency but has pegged it to within 2.25% of the Euro. This makes it a bit tricky to group but at least it has 4.5 degrees of fiscal independence…
Other major Western European countries; Norway, Switzerland, and Iceland are neither in the E.U. nor adopters of the Euro. Croatia, which is currently an E.U. member and hasn’t adopted the Euro, joined the E.U. in 2013. For the purposes of this analysis, which spans 1999-2014, Croatia will be considered a non-E.U. country like Norway, Switzerland, and Iceland.
Putting this together we will compare three categories:
- Countries that adopted the Euro in 1999 (Euro Founders): Austria, Belgium, Finland, France, Germany, Greece, Ireland, Italy, Netherlands, Portugal, and Spain
- Countries in the E.U. that have not adopted the Euro (E.U. non Euro): Bulgaria, Czech Republic, Denmark, Hungary, Poland, Romania, Sweden, and the United Kingdom
- Western European countries that have neither joined the E.U. nor adopted the Euro (Non E.U.): Croatia, Iceland, Norway, Switzerland”
Two and a half tumultuous years later, it is high time to update the analysis. We will stick with the three categories laid out above, however we will remove Croatia from the ‘Non E.U.’ group as it has now been in the EU for several years. The UK will remain in the ‘E.U. non Euro’ group because it is still in the EU, despite the Brexit vote having occurred back in June 2016. Instead of starting the analysis in 1999, when the Euro’s implementation first started, we will start at the beginning of 2000 when the last of the ‘Euro Founders,’ Greece, fixed its exchange rate to the Euro. It should be noted that actual Euro bills and coins didn’t enter circulation until 2002.
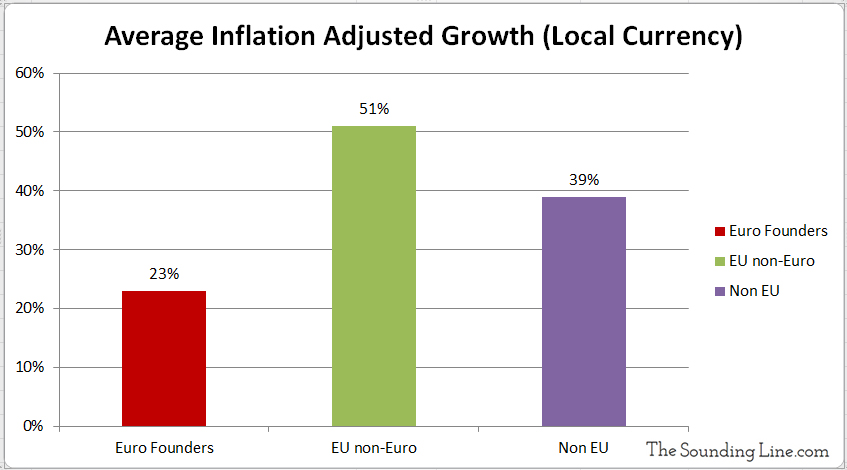
First, we look at total GDP growth from 2000 until the end of 2016 in inflation adjusted local currencies. In other words, how much did the economy of each country grow from 2000 through 2016, when adjusted for inflation?


This comparison reveals that the ‘Euro Founders’ countries have experienced an average of 23% growth since 2000, while the ‘EU non-Euro’ countries have experienced an average of 51% growth, and the ‘Non-EU’ countries have experienced an average of 39% growth. The performance of the ‘Euro-Founders’ group was aided greatly by Ireland, which has grown 93%. The other ‘Euro Founders’ all grew by an amount less than 28%. All countries outside the ‘Euro Founders’ group grew more than 28%, expect for Denmark, which has pegged its currency to the Euro. The worst performing countries were all in the ‘Euro Founders’ group: Greece (which saw negative growth), Italy, and Portugal.
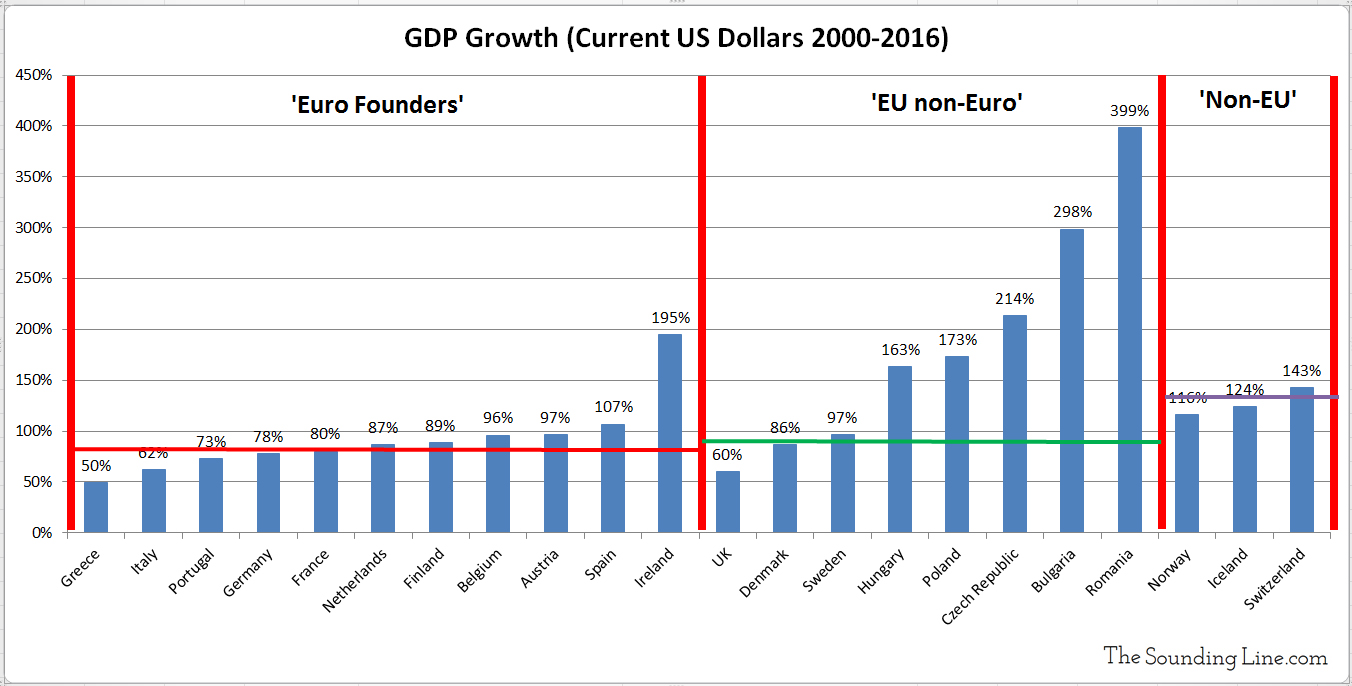
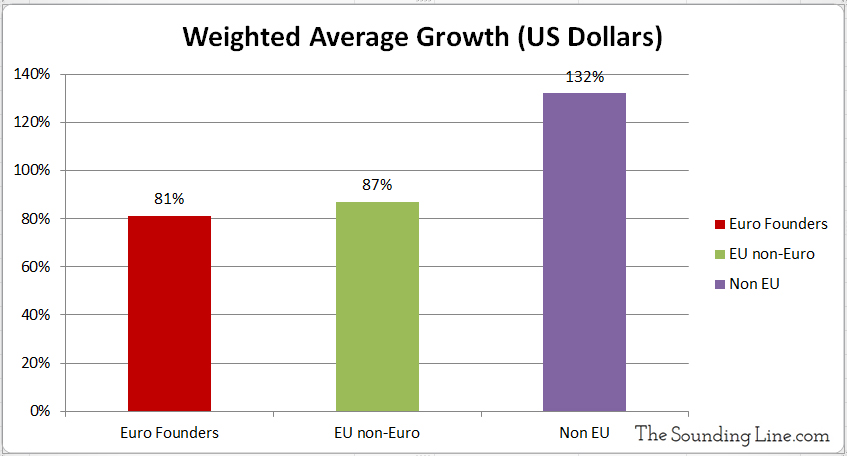
The next comparison is total GDP growth from 2000 until the end of 2016 in US dollars, without adjusting for inflation. This method will reveal the economic growth of each country, accounting for changes in currency exchange rates and enable the calculation of a weighted average GDP growth for each group.


Once again, the ‘Euro Founders’ group experienced the slowest growth (81%). Weighed down by the UK’s relatively slow growth and large economy, the ‘EU non-Euro’ group experienced only slightly better growth (87%). The ‘Non EU’ group experienced by far the best growth (132%), indicating that the non-EU economies not only grew well in local terms but that their currencies maintained sufficient value relative to the US dollar.
Conclusion:
Whether one determines economic growth by accounting for inflation or by accounting for currency exchange rate changes, those countries that first adopted the Euro have experienced the slowest GDP growth in developed Europe. In fact, many of the ‘Euro Founder’ countries have experienced nearly the slowest economic growth in the entire world. Those countries in the EU that have maintained their own currencies and European countries outside the EU have performed better. To understand why the Euro is undermining the economic growth of its adopters, take a look at Part III of the original series.
P.S. We recently added email distribution for The Sounding Line. If you would like to be updated via email when we post a new article, please click here. It’s free and we won’t send any promotional materials.
Would you like to be notified when we publish a new article on The Sounding Line? Click here to subscribe for free.

