Submitted by Taps Coogan on the 22nd of March 2018 to The Sounding Line.
Enjoy The Sounding Line? Click here to subscribe for free.
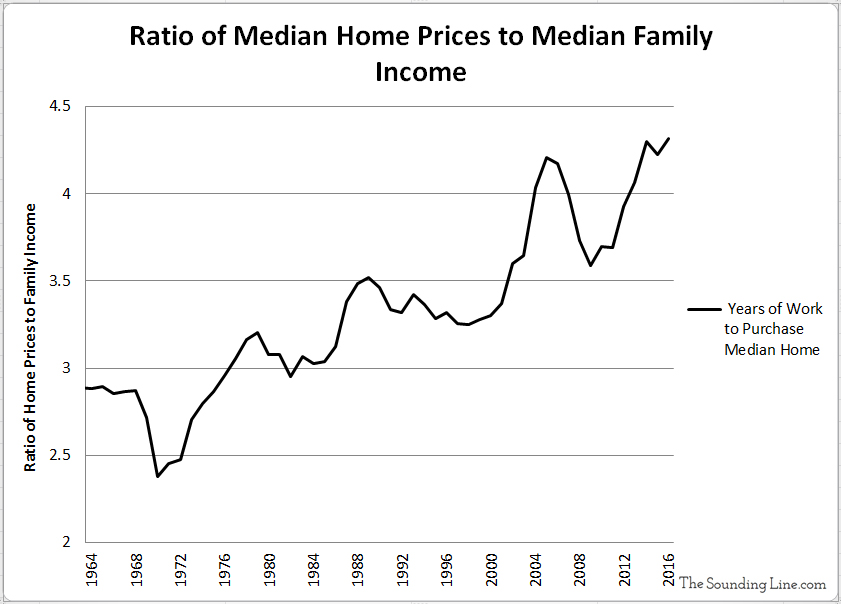
Back in October 2017, we published an article examining the relationship between median family income and median home prices. We came to the grim conclusion that it took the median American household roughly twice as many years of work to afford the median home as it did in the 1960s.

While this remains very true, commenter ‘Milton’ noted that the increase in the relative cost of homes may have as much to do with the increasing size of homes as it does with stagnating incomes:
“Wouldn’t it be more accurate to compare the cost of comparable square footage homes? The average size home today is over 100% larger than 1960.”
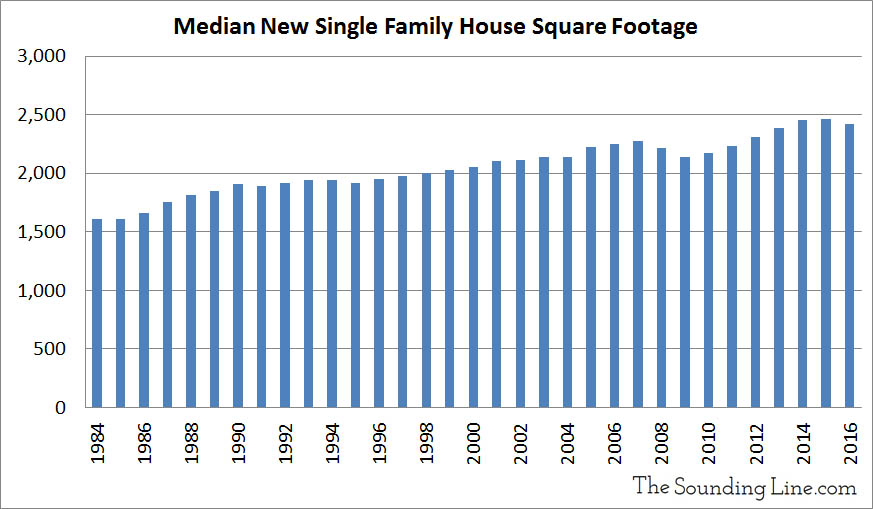
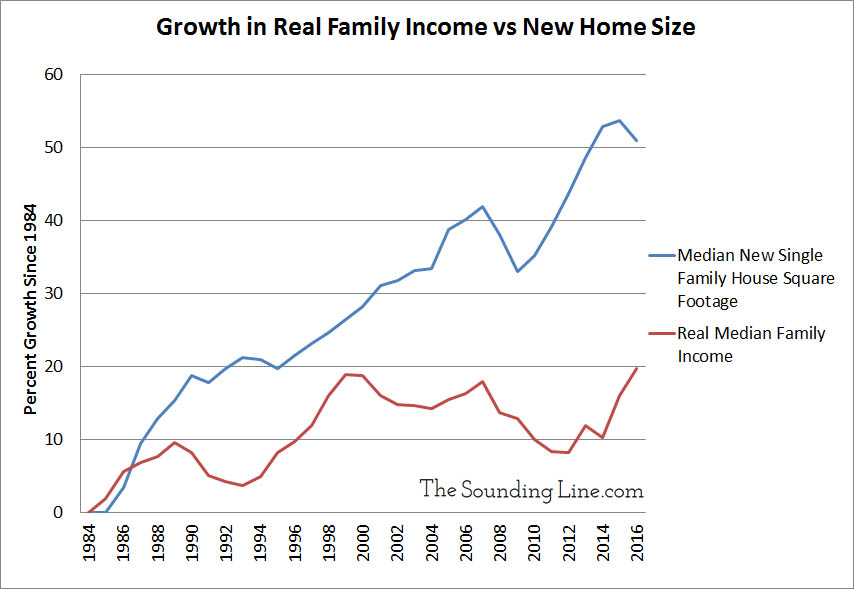
The following chart shows the median square footage of new single family houses since 1984 and is followed by a chart of the growth in inflation adjusted median family income versus median square footage for new single family homes since 1984 (the earliest available data).


As these charts show, the size of new homes has grown by over 50% since 1984, yet median family incomes have only grown by 20%. While the square footage figures only count new houses, not all existing houses, it is true that the increasing cost of the median American home is largely a result of new homes getting bigger. The following chart from the American Enterprise Institute drives this point home. Adjusted for inflation, new US homes are essentially the same price per square foot as in 1973.

While the median house still takes nearly twice as many years of work for the median family to afford, that is in no small part because new houses are getting bigger. Nonetheless, stagnant incomes sure don’t help.
P.S. If you would like to be updated via email when we post a new article, please click here. It’s free and we won’t send any promotional materials.
Would you like to be notified when we publish a new article on The Sounding Line? Click here to subscribe for free.

