Submitted by Taps Coogan on the 17th of November 2016 to The Sounding Line.
Enjoy The Sounding Line? Click here to subscribe for free.
In February and May of this year we posted articles (here and here), in which we described what we believed to be the driving forces behind the historic decline in oil prices since 2014.
What we described then, and feel is still accurate today, is that the problem of declining prices was caused by a surge in US oil production from new shale drilling technology, combined with slightly weaker oil demand, and a market denominated by a dramatically stronger US dollar. The inability of OPEC, exemplified by Saudi Arabia and more recently Iran, to fulfill its traditional ‘cartel’ role as swing producer and cut their own production to balance the market, sent oil into a full blown tailspin.
As noted in the second of the two articles, once US producers ‘elected’ to be the world’s swing producer, and production and rig counts plummeted, (about a year after prices first collapsed in 2014), it was clearly only a matter of time before the market would stabilize. Since then prices have done just that, oscillating between $40 and $50 dollars a barrel.
Yet one major underlying uncertainty remains when attempting to determine the future for oil prices:
What is the breakeven price for US oil producers?
By breakeven price, we mean the price at which production is profitable enough for US producers to arrest the US production decline, bring rigs back into the field, and start to regrow production. It is important because it signals both a point of balance in the market and a point of resistance above which it will be difficult for oil prices to exceed without some new disruption to supply, geopolitical risk, or a decline in the US dollar value.
Many people have put forward possible answers to the question ranging from the low $30s to the high $70s. In fact, it has been very difficult to determine the real ‘breakeven’ price because of the varied and constantly changing cost structure of the many US oil operations. As competitive businesses, many simply do not want to reveal their true cost structures.
That may finally be changing and the answer appears to be that the breakeven point for a significant portion of US production is in the range of: $40-50 a barrel.
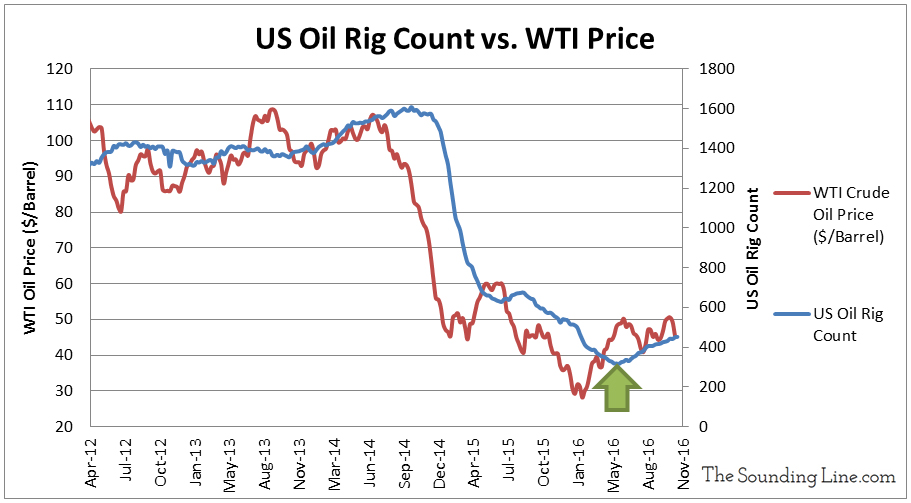
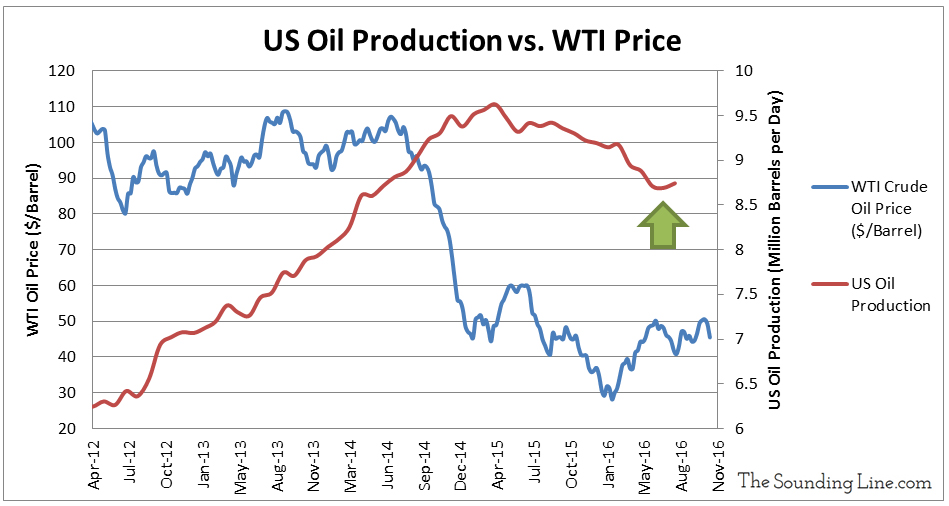
The reasoning is quite simple. Oil prices have stabilized between $40-50 a barrel since May of this year. As the charts below show, since June we have seen a sustained increase in the US oil rig count for the first time since the count collapsed in early 2015. US oil production figures from the Energy Information Agency (EIA) lag a few months, meaning that the most recent figures are from August. But August marked the largest monthly increase in US oil production since July 2015 when oil temporarily rebounded to $60 a barrel.


We will have to wait and see if the production data from the months after August confirm the trend of increasing production. Until then the fact that the rig count is showing signs of a sustained rebound is probably the best evidence you’ll get that the bulk of US oil production is profitable with oil prices above $40, an impressively low figure. US production coming back online likely helps explain the difficulty oil has had in penetrating above $50 a barrel. When that happens, as we expect it will, it likely will be the result of changes to the US dollar strength, or new geopolitical developments.
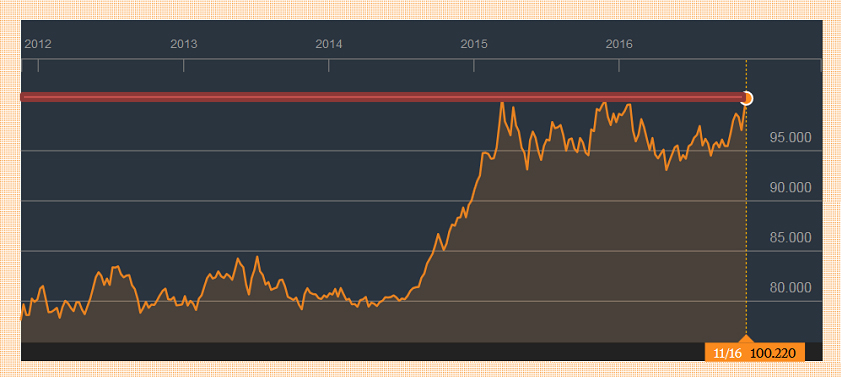
Speaking of the US Dollar, the US Dollar index is hovering right at its highs.
US Dollar Index courtesy of Bloomberg:

Would you like to be notified when we publish a new article on The Sounding Line? Click here to subscribe for free.

