Taps Coogan – October 15th, 2020
Enjoy The Sounding Line? Click here to subscribe for free.
Enjoy The Sounding Line? Click here to subscribe.
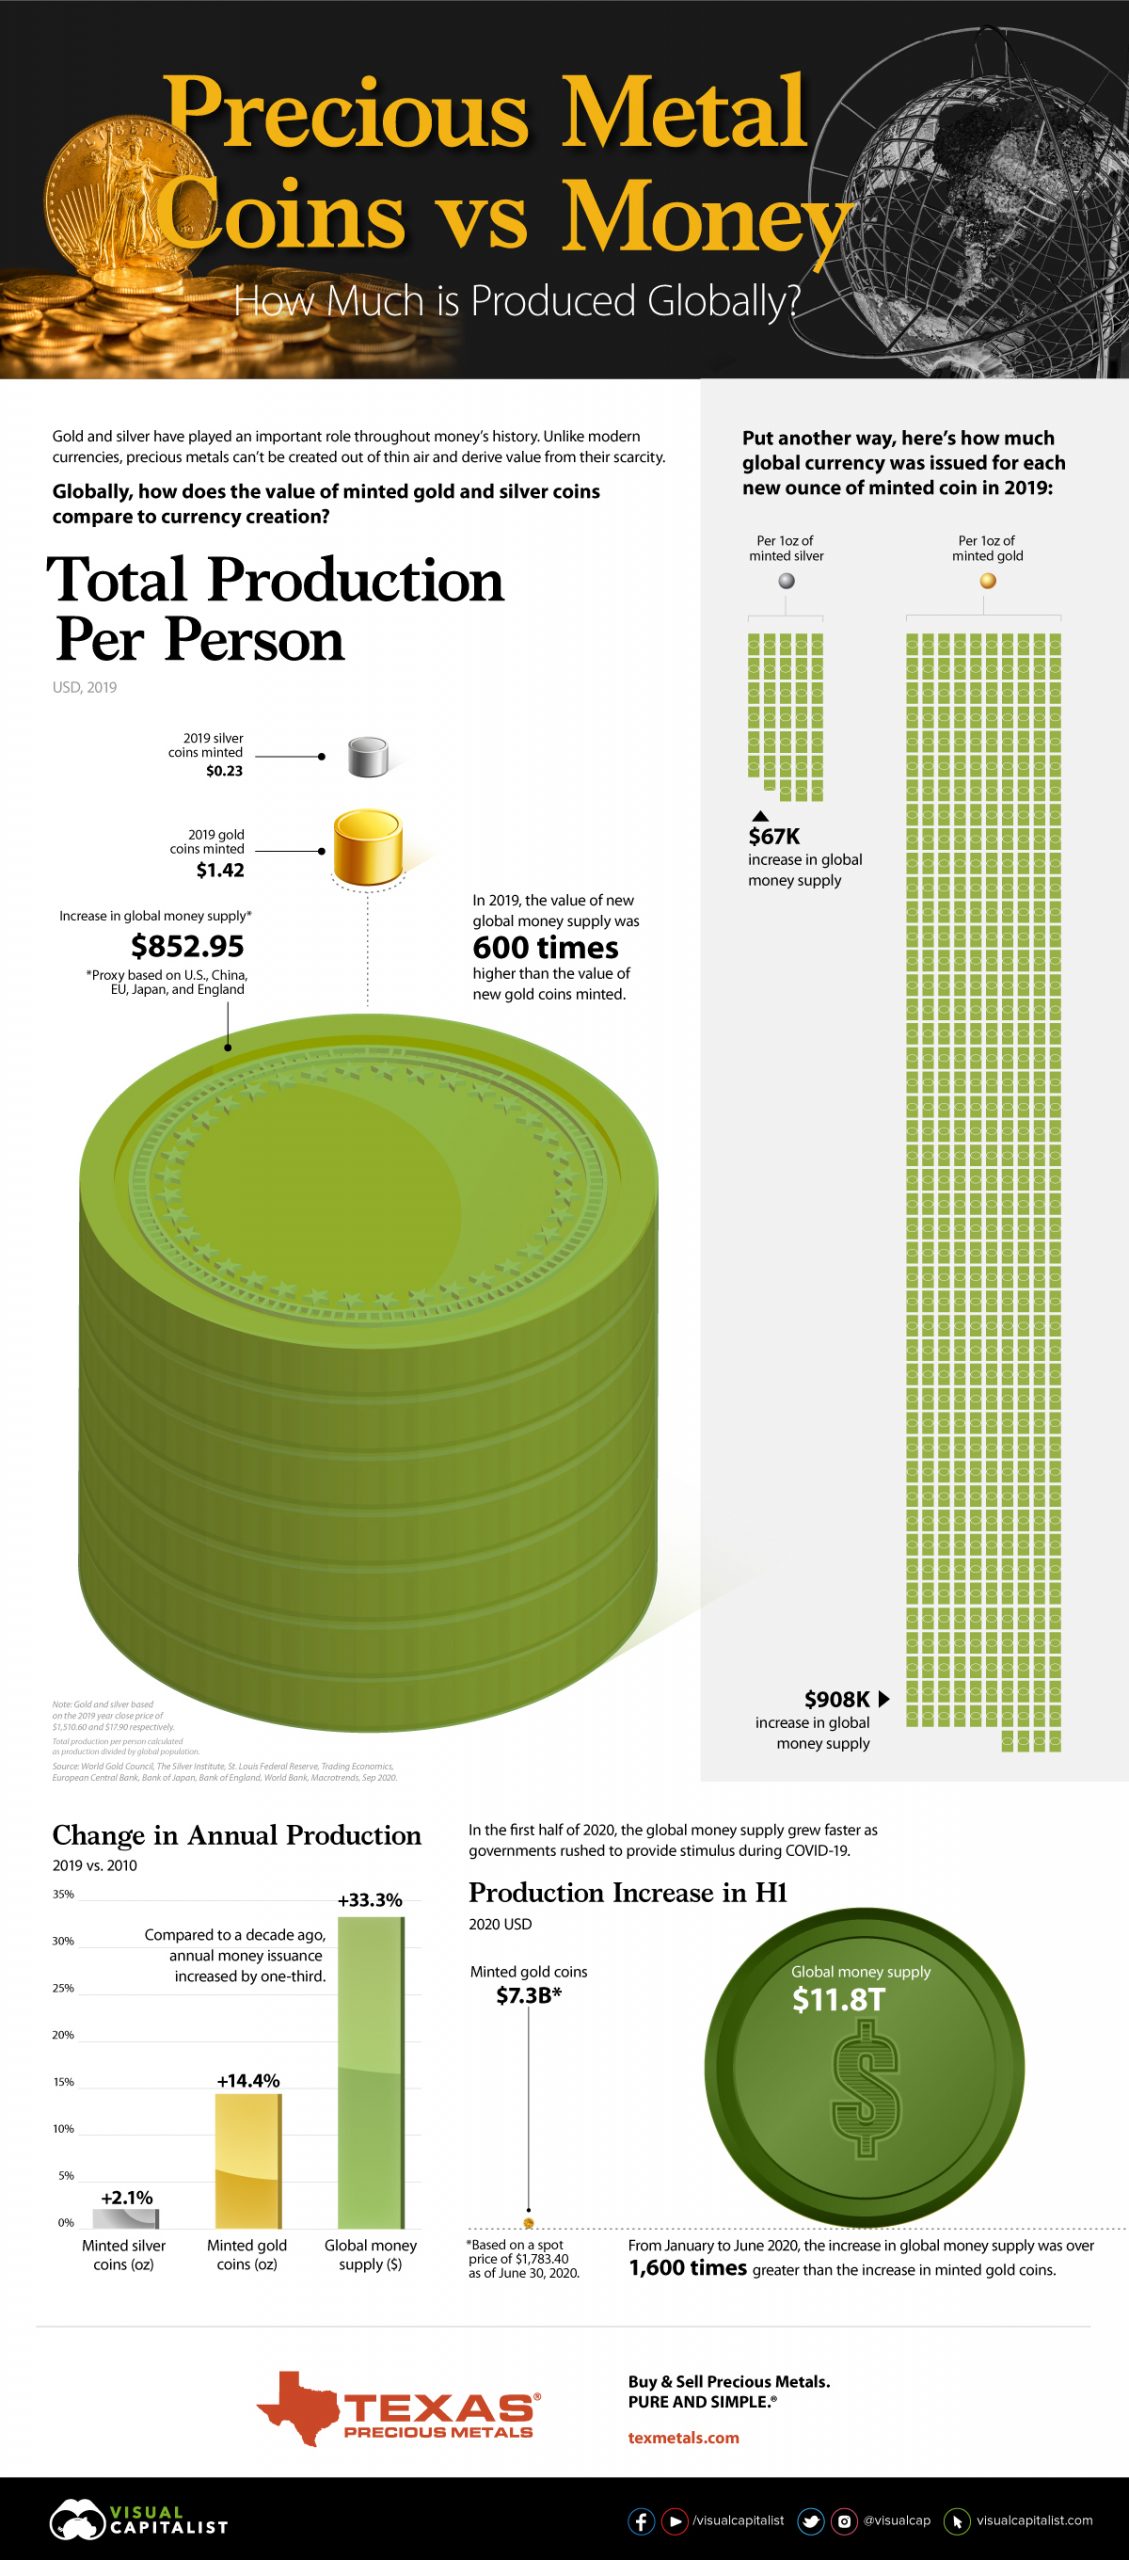
The following infographic, from Visual Capitalist and Texas Precious Metals, shows the huge discrepancy between the rate of growth in the global money supply and the annual production of precious metals like gold and silver.

As the graphic highlights, in 2019 there was an equivalent of $908,000 of money creation globally for every ounce of gold mined or $67,000 for every ounce of silver, based on pricing at the end of 2019. That was before the unprecedented surge in the money supply created by central banks’ response to the Covid recession this year but also before the associated rise in gold and silver prices.
Put differently, just $1.42 of new gold was mined per person in 2019 compared to $852 in new currency based on their estimates.
It will be interesting to see how the ratio looks at the end of 2020.
Would you like to be notified when we publish a new article on The Sounding Line? Click here to subscribe for free.
Would you like to be notified when we publish a new article on The Sounding Line? Click here to subscribe for free.

