Taps Coogan – April 1st, 2022
Enjoy The Sounding Line? Click here to subscribe for free.
Enjoy The Sounding Line? Click here to subscribe for free.
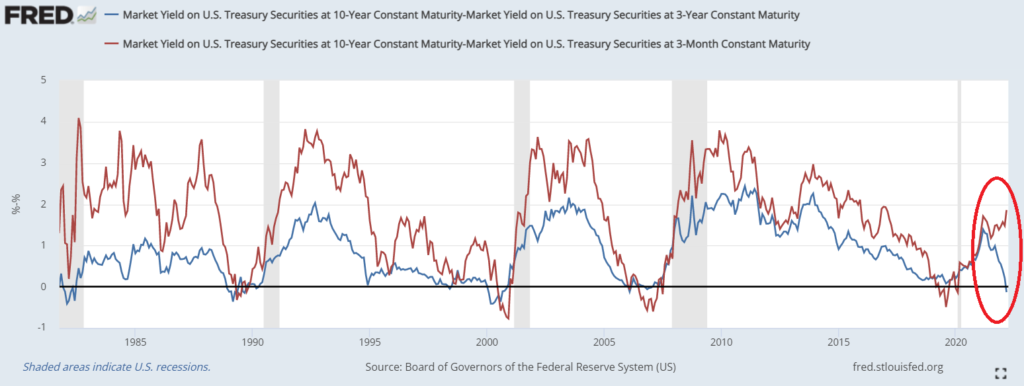
For anyone that’s keeping track, parts of the Treasury yield curve are starting to invert, as the following visual from JC Eagle shows.
The parts of the curve that are currently inverted are between the 3-Year and the 10-year. While those are not traditionally the parts used to predict recessions, they have almost always proceeded the more ‘import’ inversions (the 10y/1y, 10y/3-Month).
However, something strange is currently going on. While the middle of the curve is now slightly inverted, the long-end-to-short-end, the parts typically used for predicting recessions such as the 10y/3-month, are actually steepening, a divergence which hasn’t happened to this extent since at least 1981. It’s anyone’s guess how best to interpret this. Perhaps widening gulf between the 3-month and the 3-year is the market saying that the Fed is going to hike more slowly than otherwise anticipated.

Yield curve inversions are the best leading indicator of recessions we have. As we’ve noted many times before, the main inversions (10y/1y, 10y/3-month) have proceeded every single recession since the 1950s and only given one false alarm in the 1960s. The current inversions (10y/3y and 10y/7y) have given off one or two more false alarms and typically happen with more lead time.
The average time from an inversion of the 10y/1y is about 12 months. Part of the reason why analysts always end up questioning the yield curve’s predictive power right before every recession is because a bunch of ‘the sky is falling’ articles get written when the yield curve inverts and then, more often then not, nothing dramatic happens for a year or two.
Would you like to be notified when we publish a new article on The Sounding Line? Click here to subscribe for free.
Would you like to be notified when we publish a new article on The Sounding Line? Click here to subscribe for free.

