Taps Coogan – March 31st, 2022
Enjoy The Sounding Line? Click here to subscribe for free.
Enjoy The Sounding Line? Click here to subscribe for free.
The following chart, from Crescat Capital’s Tavi Costa shows the 2-Year Treasury yield since the late 1970s (on log-scale).
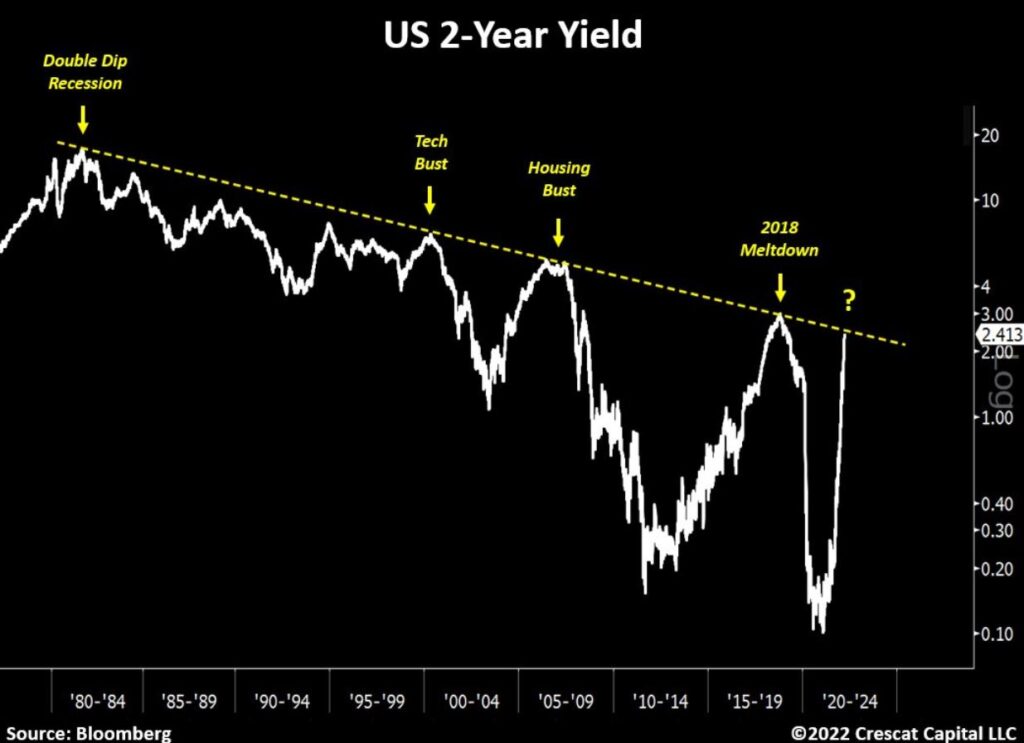
As we’ve repeatedly noted, Treasury yields are yet to break their long term declining trend line despite all that’s happened in the last couple years – including the highest inflation in 40 years.
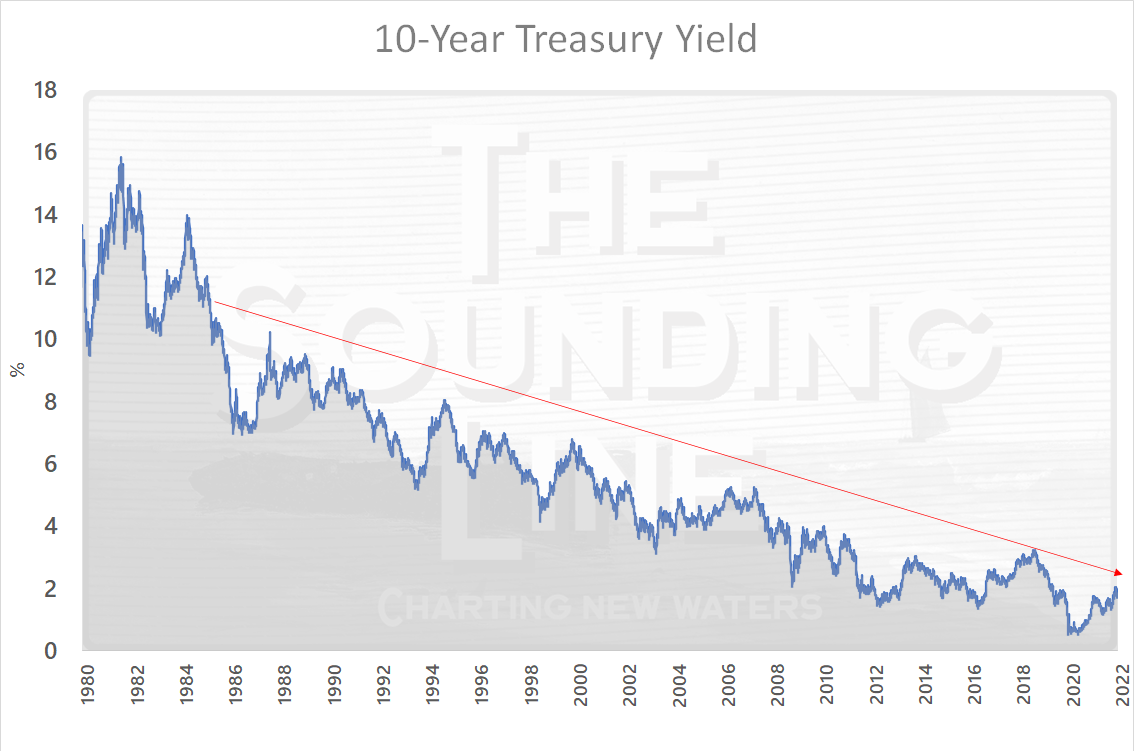
Nonetheless, we are now very close to a break out of that trend, as can be seen in the chart above. The story is similar for the 10-year, though a tiny bit of headroom remains.
If one thinks that the Fed is actually going to get through another 7+ rate hikes before inverting the yield curve, inducing a recession, and flipping to easing, then the great bond bull market is probably over. Otherwise, it’s probably time to brush on Dr. Lacy Hunt’s ‘long whimper.’ It’s make-or-break time.
Would you like to be notified when we publish a new article on The Sounding Line? Click here to subscribe for free.
Would you like to be notified when we publish a new article on The Sounding Line? Click here to subscribe for free.