Taps Coogan – April 12th, 2022
Enjoy The Sounding Line? Click here to subscribe for free.
Enjoy The Sounding Line? Click here to subscribe for free.
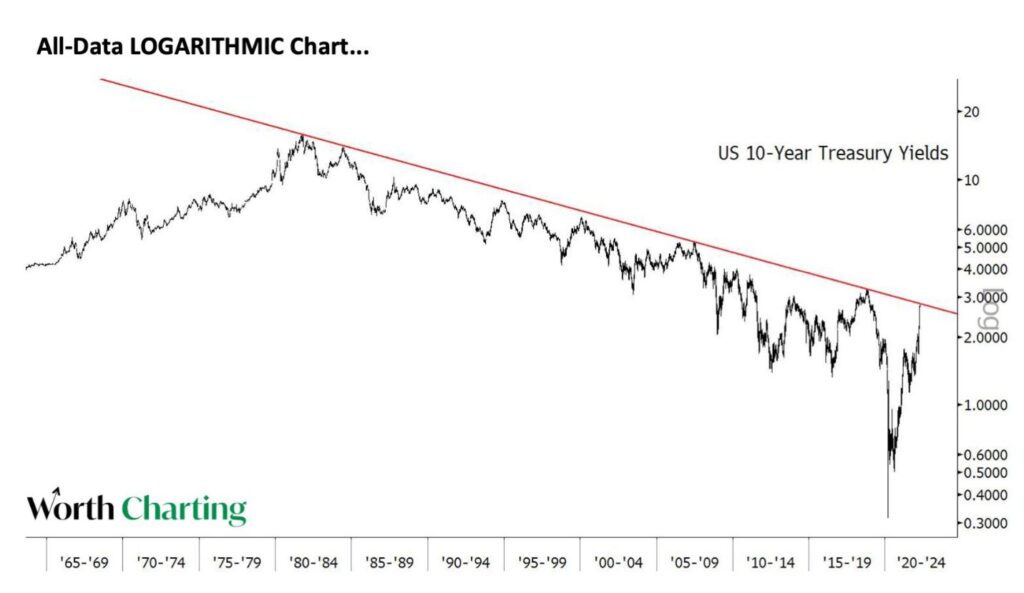
First it was the 2-year. Now, the all-important 10-year treasury has closed the gap with the 40 year trendline demarcating the bond bull market that started when Volcker hiked the Fed Funds rate to 20% in 1981, as the following chart from Carter Braxton Worth of Worth Charting highlights.

As we’ve repeatedly noted, despite all that’s happened in the last couple of years – including the highest inflation in 40 years, treasury yields are yet to break the trend line.
To the extent that one exists, the 10-year treasury is the benchmark financial asset for the global financial world. The fact the 10-year yield has been trending lower since 1981, and has consistently dropped during recessions and bear markets, has been a tailwind for markets, supporting ever more generous valuation multiples, ever more accommodative policy, ever bigger budget deficits, and ever lower mortgage rates. It also underpins the ubiquitous ‘risk-parity‘ and ‘modern portfolio‘ theories of investment.
In other words, a sustained breaching of the 10-year trendline would likely demarcate peak financialization for this cycle. Even if the 10-year drops back down to something like 1.39% but doesn’t go lower, we may eventually end up breaching this trendline ‘going sidewise.’
This is the return of cold hard reality to a world that has spent decades pretending it didn’t exist.
Would you like to be notified when we publish a new article on The Sounding Line? Click here to subscribe for free.
Would you like to be notified when we publish a new article on The Sounding Line? Click here to subscribe for free.

