Taps Coogan – September 22nd, 2022
Enjoy The Sounding Line? Click here to subscribe for free.
Enjoy The Sounding Line? Click here to subscribe for free.
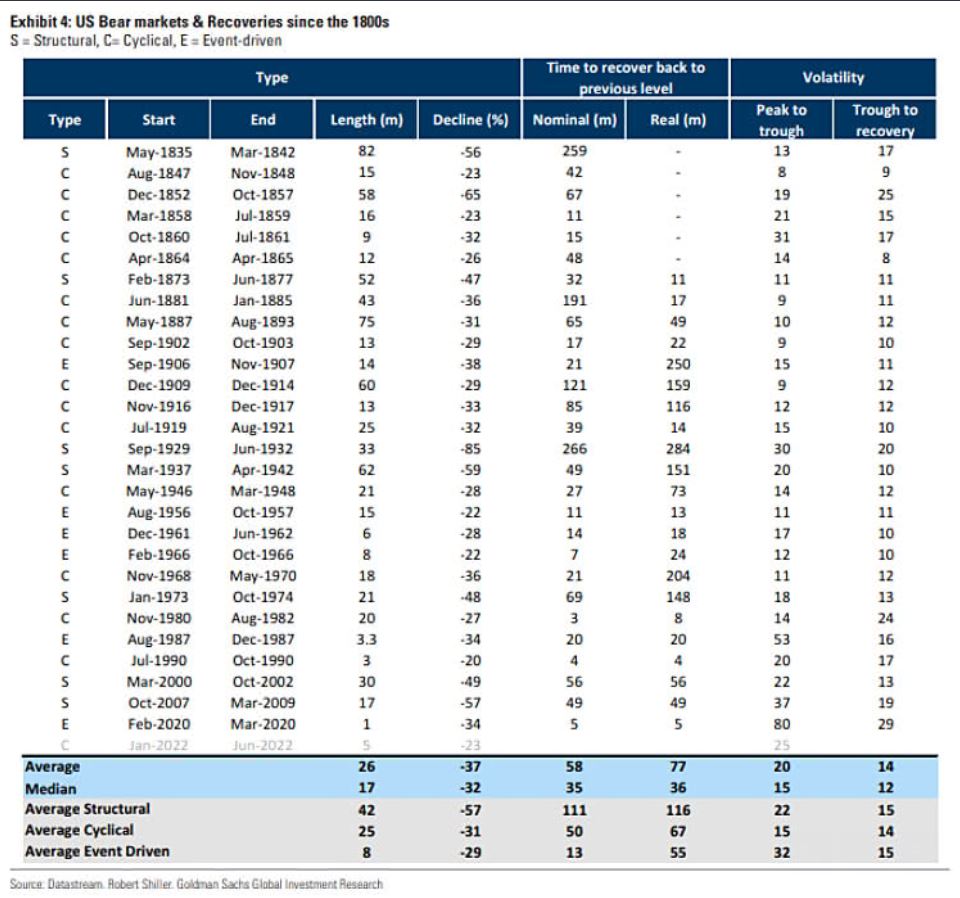
Back in July, we posted an article looking at more-or-less every bear market (as defined by Goldman) in the US since the 1800s. The punchline was that the median drawdown for stocks was 32% and lasted about a year and a half.

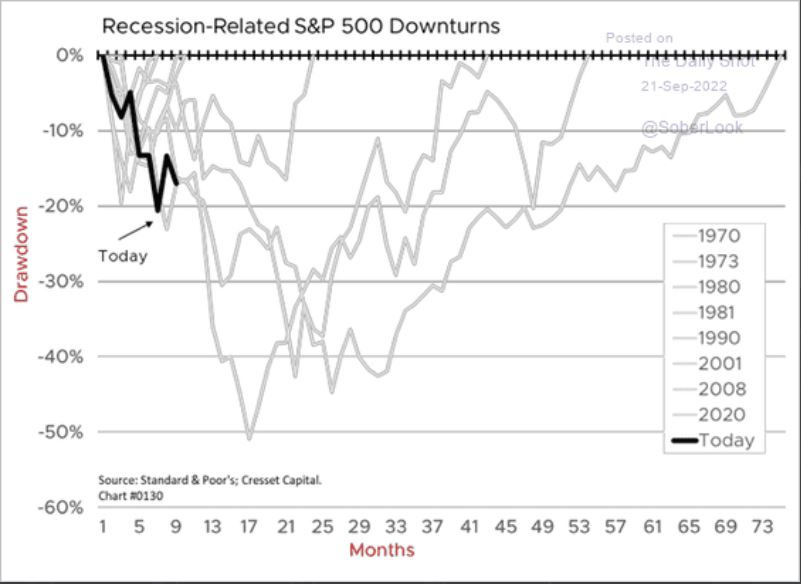
The greatest peak-to-trough decline for this bear market is about 23% (for now…) on the S&P 500 which equates to the sort of decline one would expect from a mild recession.
The following chart, via Win Smart, zooms in on the S&P 500 drawdowns during more recent recessions.

The punchline is the same as the first table. The current peak-to-trough drawdown is in line with the milder recessions but not the big ones like the Global Financial Crisis or the Dot-Com bubble.
Yours truly has argued that this need not be a 100-year crisis as relatively large declines in most indicators like consumer spending, the job openings, corporates earnings, etc.. would just bring us back to the pre-Covid growth trends. That would be a recession on a rate-of-change basis but not analogous to the Global Financial Crisis.
That being said, the Fed is insisting on hiking rates far faster than their effects can be assessed and doing so on the backside of a historic stock bubble and record high debt levels. If you wanted to engineer a bad outcome, that’s how you’d do it. The opportunity to tighten aggressively was last year when quarterly GDP was 12%. Now it must be done more cautiously.
Virtually every time the S&P 500 has declined more than 25% we’ve had a formal recession. The market looks intent on retesting the June lows and unless the Fed changes tack, why would those lows hold?
Would you like to be notified when we publish a new article on The Sounding Line? Click here to subscribe for free.
Would you like to be notified when we publish a new article on The Sounding Line? Click here to subscribe for free.

