Taps Coogan – June 1st, 2022
Enjoy The Sounding Line? Click here to subscribe for free.
Enjoy The Sounding Line? Click here to subscribe for free.
The following chart, from the Bank of America (BofA) via Mike Zaccardi, show the S&P 500 Index since 1929 on a logarithmic scale.
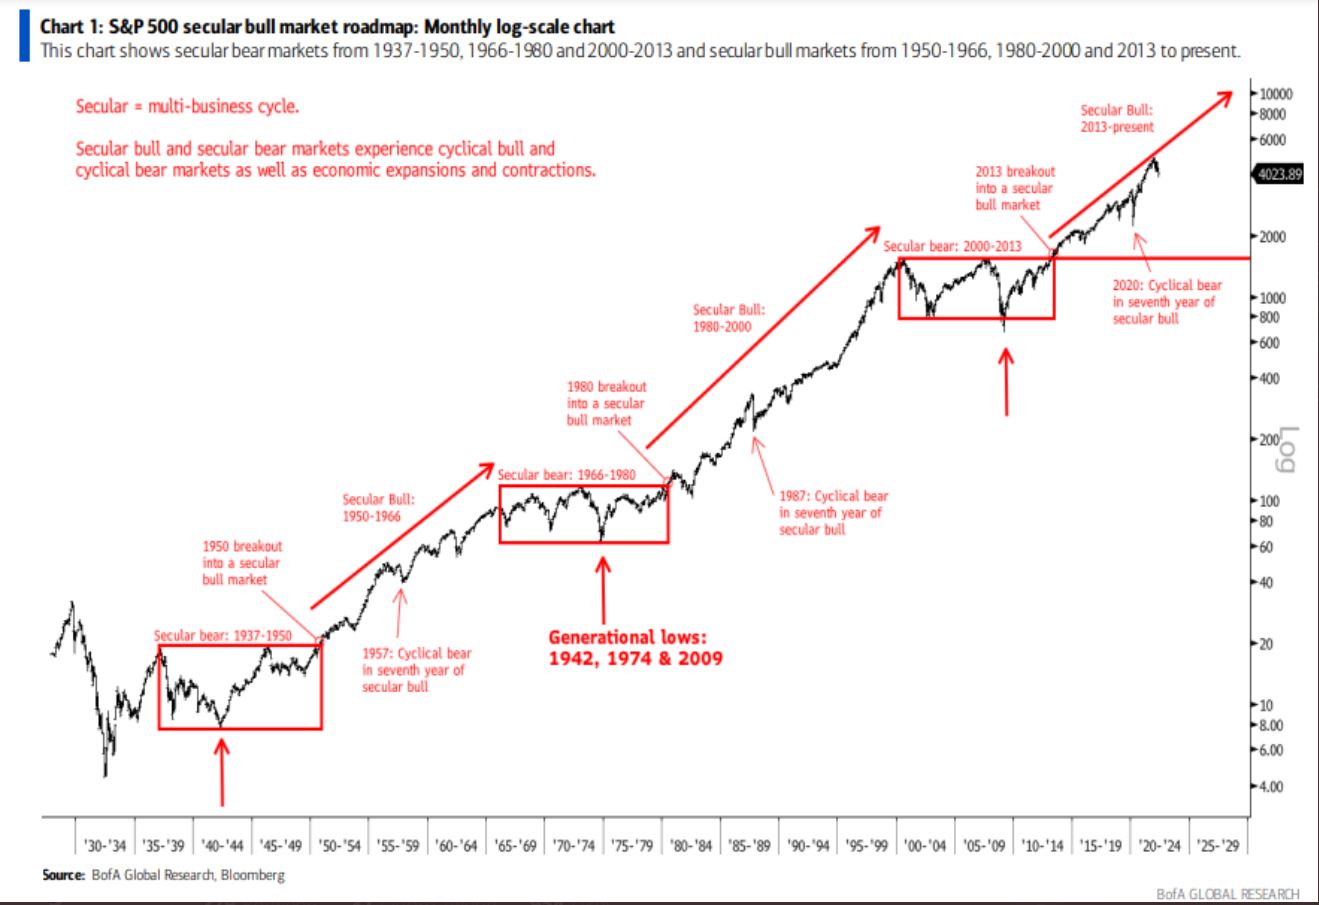
The punchline of the chart above is that we have had three protracted secular bear markets since the Great Depression: 1937-1950, 1966-1980, and 2000-2013. The interluding times have been secular bull markets, with the prior two secular bull markets lasting 16 years (1950-1966) and 20 years (1987-2000). The current secular bull market (assuming it’s still alive) is ‘only’ nine years old based on BofA’s methodology (bull markets start when the S&P 500 takes out the bear market starting highs) and thus is really not as long-in-the-tooth as it seems.
Just some food for thought.
Would you like to be notified when we publish a new article on The Sounding Line? Click here to subscribe for free.
Would you like to be notified when we publish a new article on The Sounding Line? Click here to subscribe for free.

So everything around me is far out of reach based on incomes (I don’t know a single working person that can afford to buy the house they live in on current incomes) and what this chart says it’s all up from here?
I might as well just get a rope, same for anyone under 30. No possible way they will ever make enough $ to survive. The big joke with every single person I know is getting the F out of California because nobody can afford to live here. And based on that chart we ain’t seen nothing yet.