Taps Coogan – December 15th, 2020
Enjoy The Sounding Line? Click here to subscribe for free.
Enjoy The Sounding Line? Click here to subscribe.
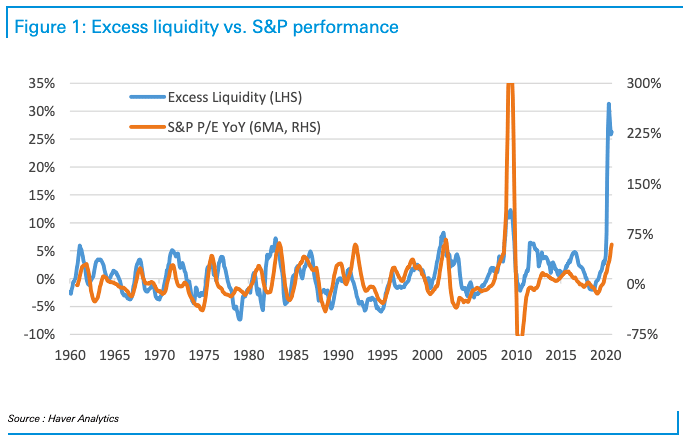
From Deutsche Bank via Isabelnet, the following chart shows excess liquidity compared to year-over-year growth in the S&P 500 PE ratio.

Historically, there has been a reasonable degree of correlation between excess liquidity and growth in the PE ratio of the S&P 500. Somewhat counter-intuitively, the jump in excess liquidity during the Global Financial Crisis produced a record PE surge during the recession and bear market as prices fell faster than earnings. Today’s much larger surge in excess liquidity occurs during a recession but in a bull market. Will the PE continue to rise in proportion or has the magnitude of the liquidity injection short-circuited the relationship?
Would you like to be notified when we publish a new article on The Sounding Line? Click here to subscribe for free. Also, please consider sharing this article so that we can grow The Sounding Line!
Would you like to be notified when we publish a new article on The Sounding Line? Click here to subscribe for free.

