Submitted by Taps Coogan on the 22nd of February 2016 to The Sounding Line.
Enjoy The Sounding Line? Click here to subscribe for free.
In ‘Energy Prices – The Crude Oil Divergence’ (link here) we discussed the divergence that developed between crude oil prices and natural gas and coal prices after the 2008 financial crisis. In that article we noted that natural gas prices declined quickly after U.S. production increased and imports decreased whereas oil prices continued to build for many years after U.S. imports of oil decreased.
This leads us to ask:
What has caused the dramatic decline in oil prices since June 2014?
As a percentage of consumption, U.S. net oil imports peaked in 2004 and the absolute quantity of U.S. net imports has been declining every year since 2006. Yet the price of crude continued to increase until June 2014. Because of the many years between the relative and absolute peaks in oil imports (2004 and 2006 respectively) and the dramatic price decline since 2014, it is unlikely that increasing U.S. production, alone, explains the rapid price deterioration that has taken place since 2014.
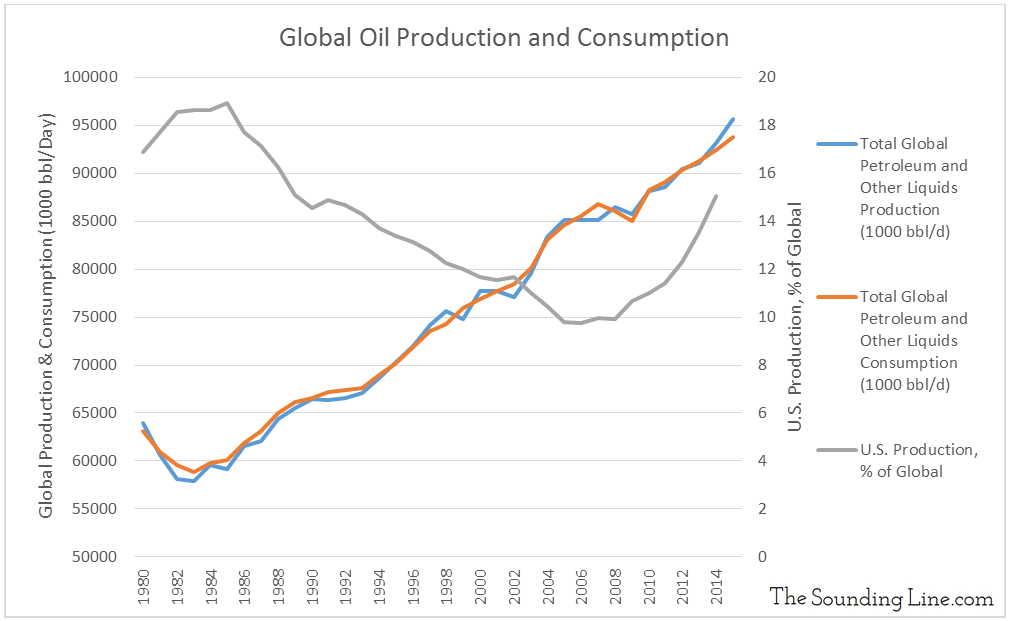
As the chart below shows, while U.S. production has undoubtedly surged for over a decade, overall growth in global production through 2015 appears generally in line with the historic trend. Of equal note, global consumption has continued to grow at normal levels. In other words, both supply and demand are trending within historic norms.
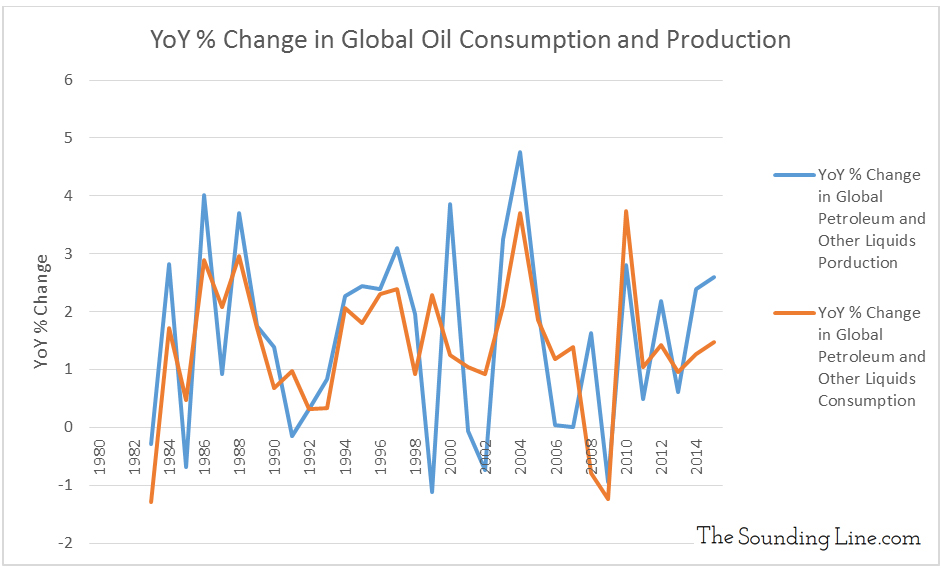
If we look at year-over-year (YoY) changes in annual global oil production and consumption, we can see that production outstripped consumption in 2014 and 2015. However, the growth rate in production is not historically high, nor is the growth rate in consumption historically low.
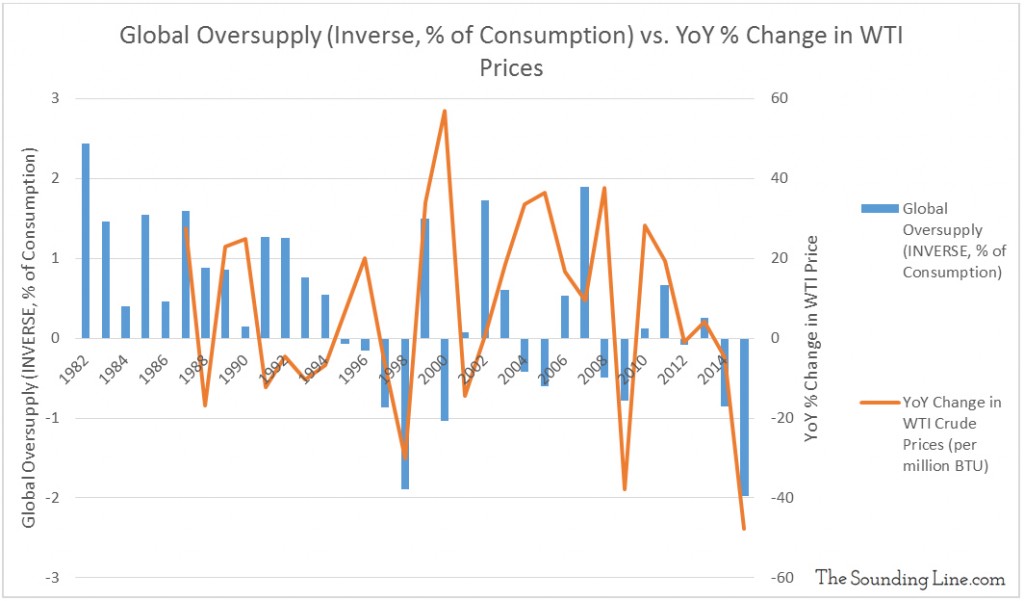
Looking at global ‘oversupply’ (production minus consumption) as a percentage of consumption and looking at yearly changes in crude oil prices, we can see the relationship between the two. It is not unusual for the oil market to experience multiple years of oversupply. This has happened in 1995 -1998, 2004-2005, 2008-2009, and 2014-2015. In all those cases, except 2004-2005, this oversupply resulted in price declines. Historically the relationship between the magnitude of oversupply and price change has not been consistent. In 1997 and 1998 the market was oversupplied by proportionately the same amount as in 2014-2015 and yet the price decline was more moderated.
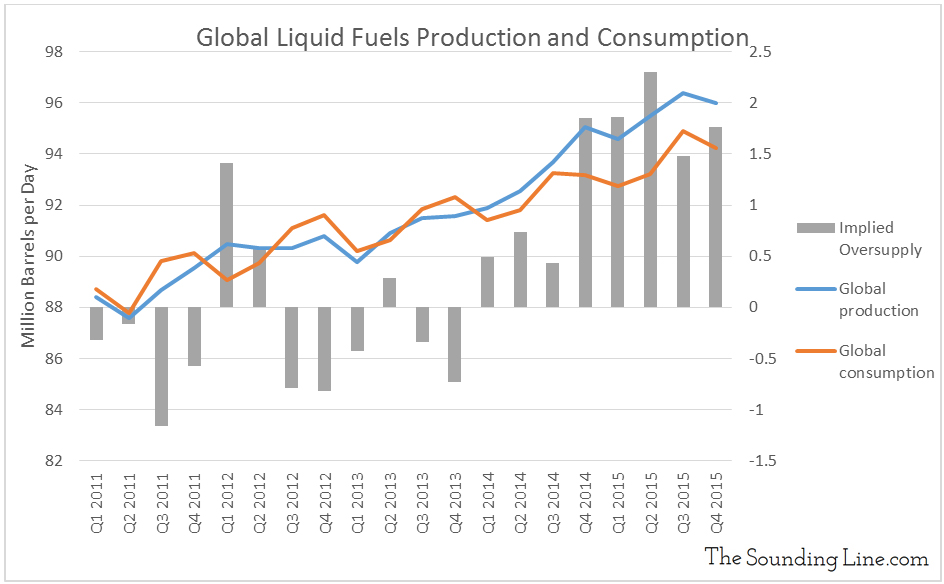
Zooming in on the trend since 2011, we can see again that the markets have been oversupplied every quarter since the start of 2014.
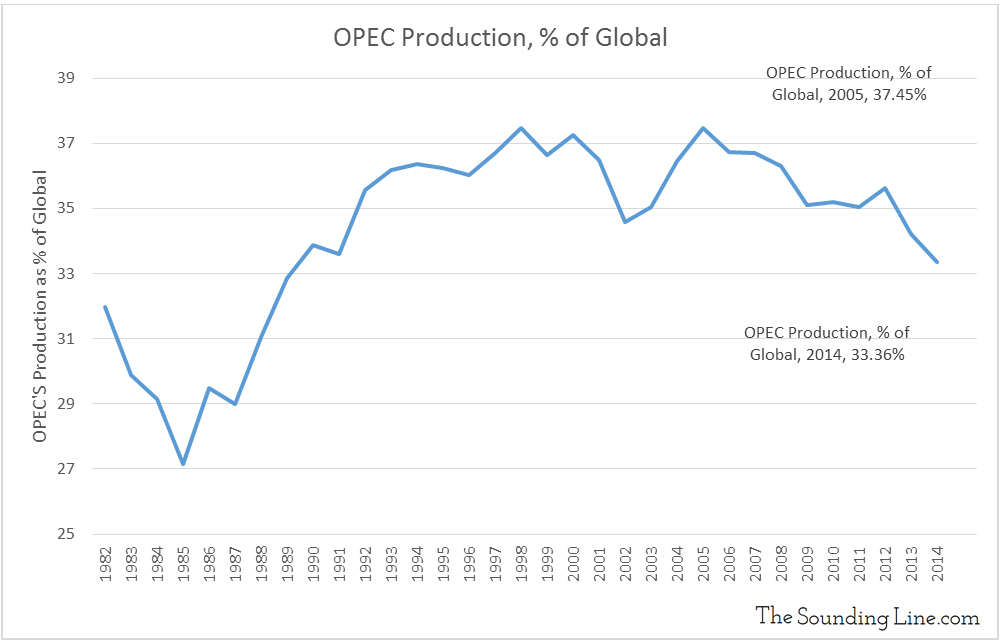
The chart below show that OPEC’s market share has been declining since 2005.
To recap:
- U.S. production had been increasing for a decade before prices collapsed in June 2014
- U.S. imports had been decreasing for eight years before the prices collapsed in June 2014
- Global oil production grew at a slightly elevated rate in 2014 and 2015
- Global consumption continued to grow at a slightly depressed rate in 2014 and 2015
- A significant oversupply developed in Q4 2014, resulting in price declines
- Similar levels of oversupply in 1997 and 1998 resulted in more moderated price decline
- OPEC’s market share has been decreasing for the last ten years
All of these points taken together create a reasonable narrative for why oil prices would be declining but not a sufficient explanation for why they are declining so radically. The global supply and demand dynamics are not exceptional enough to fully explain the price decline.
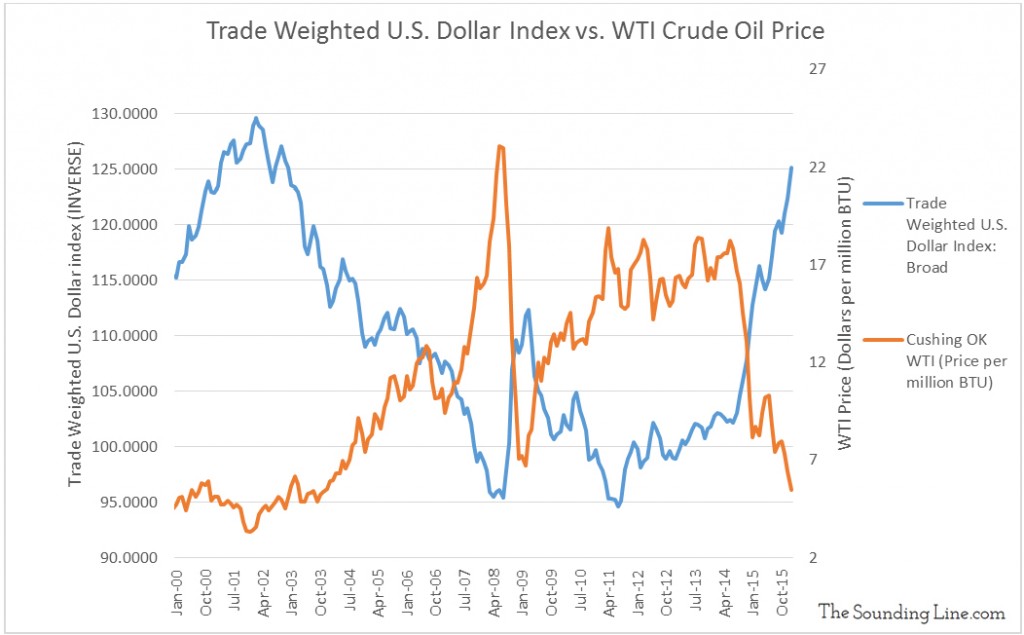
There is one important and generally overlooked fact about the price of oil, namely that global oil markets are priced almost exclusively in U.S. dollars. If the value of the dollar goes up, all other things being equal, one would be able to purchase more oil for the same number of dollars. The best way to measure changes in the value of the dollar that effect its purchasing power for an international commodity like oil is to look at the exchange rates between the dollar and the currencies of other major trading economies. Unlike other metrics of the dollar’s value, such as inflation metrics, this approach mitigates most reciprocal effects that the value of oil may have on the value of the dollar.
The chart below shows that the decline in oil prices corresponds very strongly with the recent surge in strength of the U.S. dollar as measured by a trade weighted currency index. Since 2014 the dollar has strengthened against literally all other major oil importing countries’ currencies: the Euro, the British Pound, Swiss Franc, Japanese Yuan, the Chinese Yuan, South Korean Won, etc… The strength of the U.S. dollar as compared to these currencies is primarily a function of the divergence between U.S. monetary policy, which has been tightening since the beginning of 2014, and nearly every other major country in the world, which have lowered interest rates and/or directly devalued their currencies. Thus the most important question for oil’s future may have little to do with a rather unremarkable oversupply issue and much to do with whether the Fed’s tightening policies are sustainable.
Would you like to be notified when we publish a new article on The Sounding Line? Click here to subscribe for free.


The Fed can’t keep tightening, its a folly.
Strong dollar never lasts…
All eyes will be on the Fed in March. Its going to be a very important meeting in terms of solidifying expectations.