Taps Coogan – October 20th, 2022
Enjoy The Sounding Line? Click here to subscribe for free.
Enjoy The Sounding Line? Click here to subscribe.
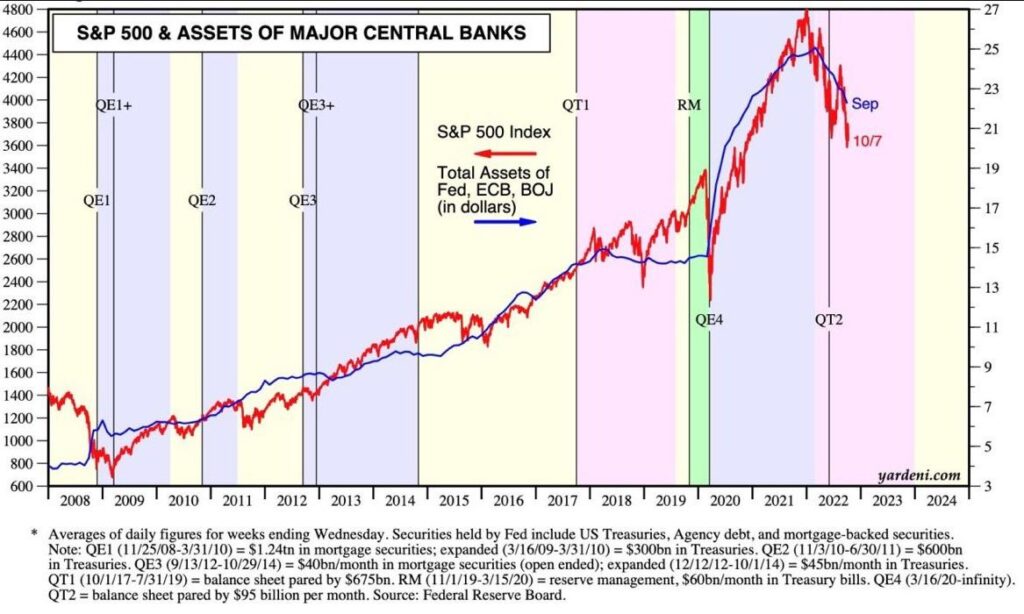
The last time we pointed out a prior version of the chart below, we noted “We’ve been talking about various iterations of the following chart since the earliest days here at The Sounding Line. That’s because it’s the only chart that has really mattered to global financial markets for the last 13 years. From the look of it, that remains as true as ever.”
So here it is yet again, via Jeroen Blokland:

All QE does is increase the amount of money chasing financial assets while reducing the number of tradeable financial assets.
Quantitative tightening (QT) does the opposite.
If you study the chart above, you’ll notice that the last Fed tightening cycle, circa 2018, did not reduce the ‘Big Three’ central bank balance sheet by much at all. That’s because the BoJ and ECB were still doing QE. As Rick Santelli famously quipped at the time “all stimulus is fungible.”
This is already likely the largest decline in the combined balance sheet since the Great Depression. The reaction in financial markets has been pretty unambiguous.
Would you like to be notified when we publish a new article on The Sounding Line? Click here to subscribe for free.
Would you like to be notified when we publish a new article on The Sounding Line? Click here to subscribe for free.

