Submitted by Taps Coogan on the 22nd of May 2016 to The Sounding LIne.
Enjoy The Sounding Line? Click here to subscribe for free.
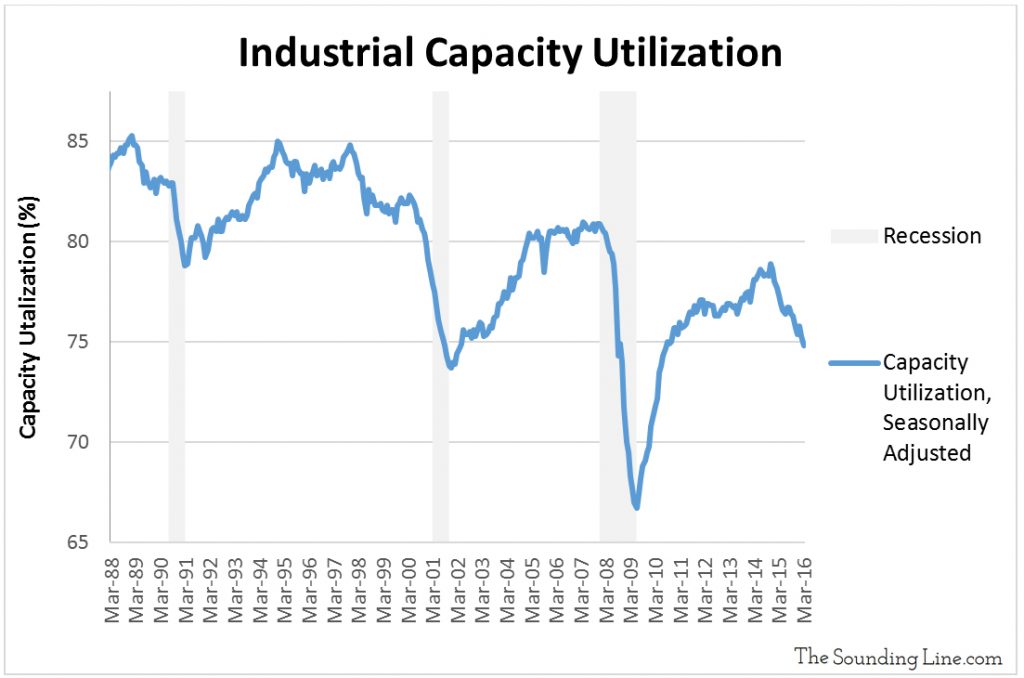
One useful way to assess the health of the US economy is to analyze the percentage of the nation’s existing industrial production capacity that is actually being productively utilized. In a healthy or recovering economy, with growing demand for goods, one would expect to see increasing utilization of production capacity. Conversely, in a weakening economy, with slowing demand for goods, capacity utilization would be diminishing.
The US Federal Reserve tracks industrial capacity utilization in the US and defines it as:
“Total Industry Capacity Utilization (TCU) is the percentage of resources used by corporations and factories to produce goods in manufacturing, mining, and electric and gas utilities for all facilities located in the United States (excluding those in U.S. territories). We can also think of capacity utilization as how much capacity is being used from the total available capacity to produce demanded finished products.”
As might be expected, declines in capacity utilization are generally correlated with periods of recession. That’s why the chart below is so concerning.

According this metric, industrial capacity utilization has recently fallen the most since the 2008 financial crisis, and by an amount that typically is occurs immediately prior to, or during, a formally declared recession.
While the Fed continues to maintain that the US economy is moments away from hitting escape velocity, we are compelled to add declining industrial capacity utilization to the growing list of indicators that we have discussed here at The Sounding Line which reveal that the US is currently experiencing recessionary conditions:
Declining Rail Traffic (here)
Declining Home Ownership rate (here)
Declining New Home Prices (here)
Declining Industrial Production (here)
Declining Velocity of Money (here)
Declining Labor Participation (here)
Declining Corporate Earnings (here)
Declining Mining Production (here)
Declining Global Trade & Commodity Prices (here)
What does the ‘data dependent’ Fed think about all of this? Apparently not much.
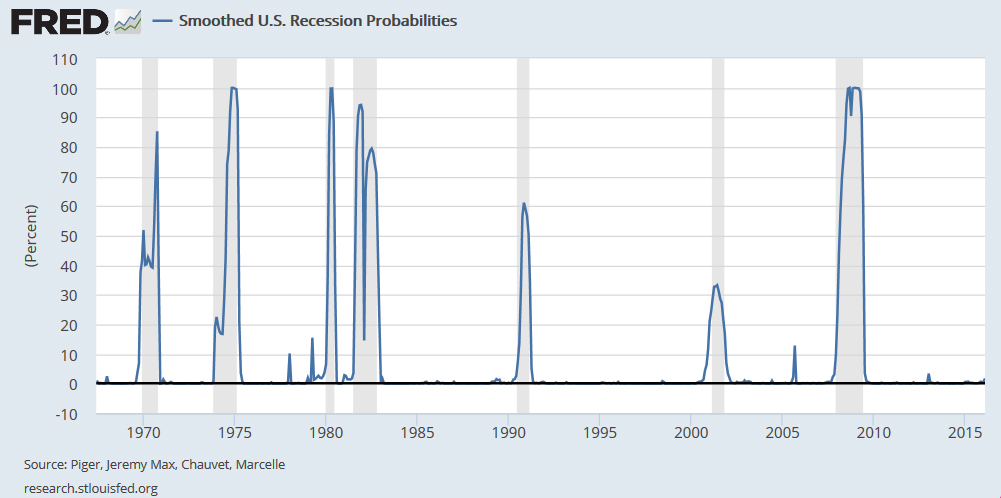
As the chart below shows, they estimate the probability that the US is currently in a recession to be merely 1.78%. This is of course based on their very sophisticated “dynamic-factor markov-switching model applied to four monthly coincident variables: non-farm payroll employment, the index of industrial production, real personal income excluding transfer payments, and real manufacturing and trade sales.” A model which, laughably, estimated a 0.74% probability of recession in September 2007, as the economy was decelerating in the months before the biggest economic crisis since the great depression was formally declared.
Even more astounding, by December 2007, after a recession had already been declared by the Fed, the probability of a recession was still only 9.52% based on this model.

It’s little surprise that the Fed never sees a recession until it is so painfully obvious to everyone as to be undeniable. The self-referential model that they use to estimate the probability of a recession lags behind even their own delayed declarations.
Confidence inspiring…
Would you like to be notified when we publish a new article on The Sounding Line? Click here to subscribe for free.

