Submitted by Taps Coogan on the 20th of May 2017 to The Sounding Line.
Enjoy The Sounding Line? Click here to subscribe for free.
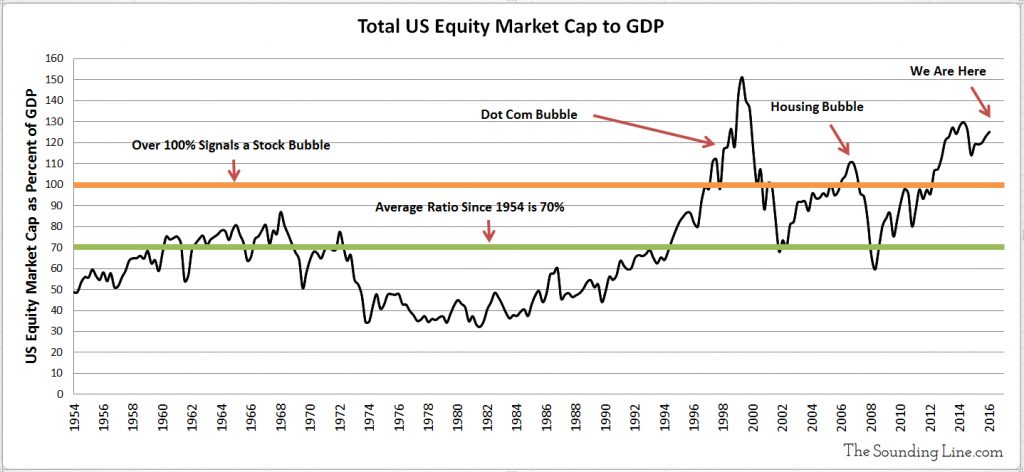
‘Since 1954 corporate equity market cap has averaged 70% of GDP. Today it stands over 125%’
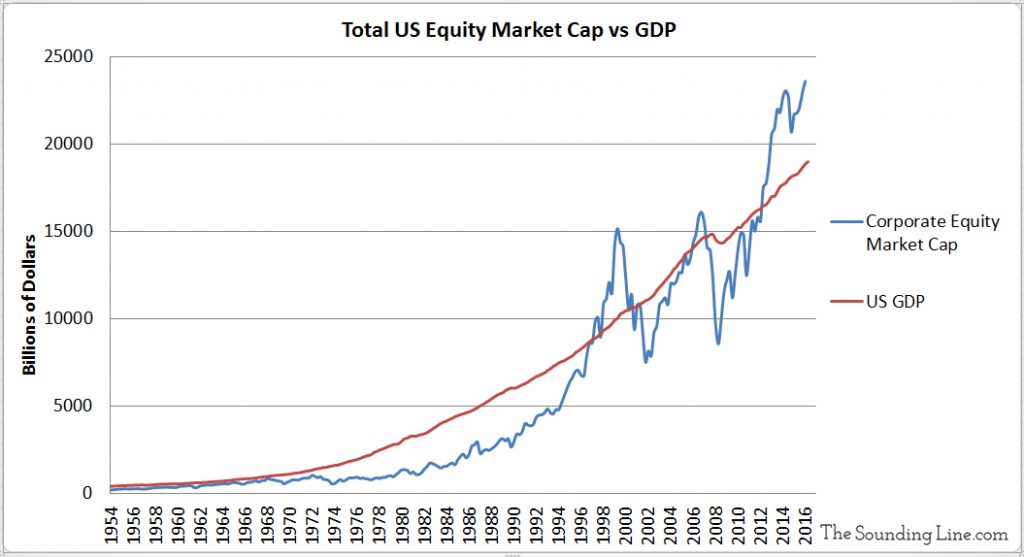
Over the past year, here at The Sounding Line, we have presented a number of analyses which indicate that US equity prices have surpassed values supportable by underlying economic conditions (here, here, here).
Along these lines, we present yet another indicator which describes the relationship between stock prices and the underlying economy, namely the ratio between total US non-financial corporate equity market capitalization (the value of all non-financial corporations in the US) versus the total value of US economic activity (US GDP). Warren Buffett has in the past called this ratio “probably the best single measure of where valuations stand at any given moment.” As evident in the two charts below, US corporate equity valuations are now larger than the entire US economy (as measured by GDP) and at levels only seen from 1998-2001 during the dot-com bubble and from 2006-2007 during the height of the housing bubble. Since 1954 corporate equity market cap has averaged 70% of GDP. Today it stands over 125%.


After eight years of rising US equity prices (one of the longest bull markets in history), it has become increasingly difficult to reconcile continued stock market appreciation with persistently sluggish economic growth across the entire developed world, disappointing economic data coming out of China, and heightened geopolitical tensions.
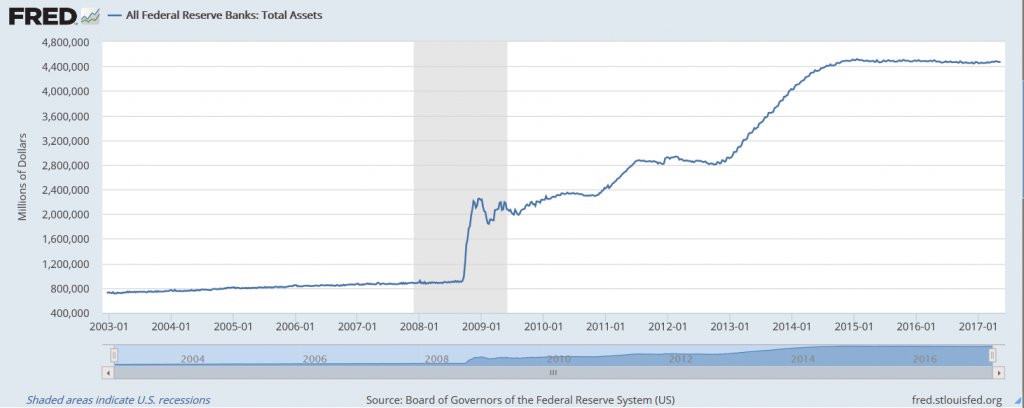
Many explanations have been put forward to explain the resilience of this bull market in the face of such weak underlying fundamentals. First there is the continued printing of tens of trillions of dollars by central banks around the world. Many analysts have pointed out the strong correlation between growth in the central bank balance sheets and rising stock prices. The vast majority of the money created by the Federal Reserve and other central banks has stayed within the financial system, buoying financial asset prices while doing little for the underlying economy. This money printing continues to this day at all major central banks, including the Federal Reserve. Despite claiming to have ended its QE program in 2014, the Federal Reserve only stopped expanding the program. As the bonds that the Federal Reserve purchased through its QE programs mature, the Federal Reserve replaces them by purchasing new ones, keeping its balance sheet at its highest levels ever. This has created a continual injection of liquidity into the financial system despite the official end of QE.

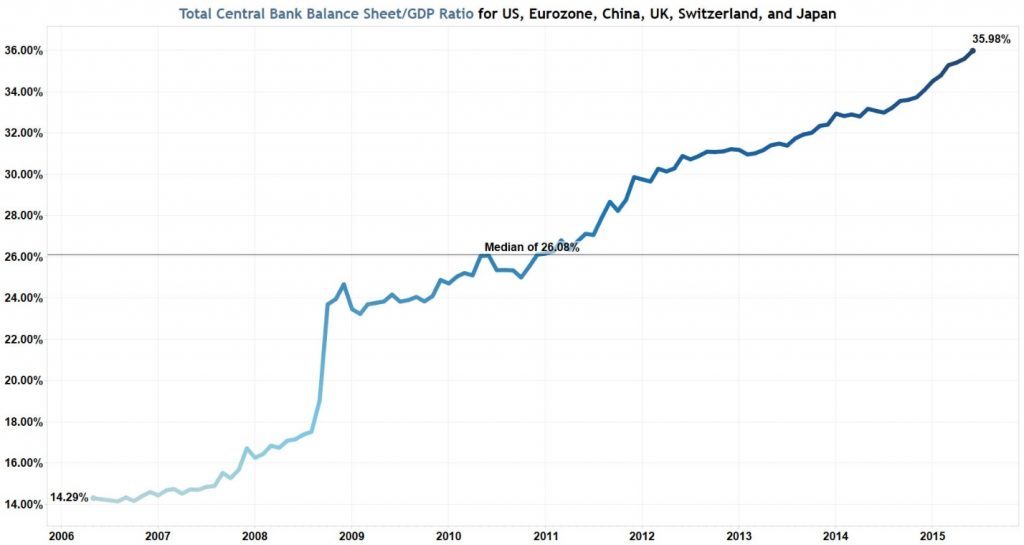
Central banks have printed enough money to buy assets worth over 1/3 of the economies of the US, Eurozone, China, UK, Switzerland, and Japan combined!

Weak underlying economic fundamentals owing to a complete lack of economic, fiscal, and regulatory reforms in the US and the EU for the eight years following the 2008 financial crisis, has meant that investing in the real economy is a relative ‘non starter.’ Industrial capacity utilization remains at recessionary levels, and thus new capital formation and bank lending have been accordingly sluggish.
The lack of appetite for investment in the ‘real’ economy, extremely low returns on fixed income, and geopolitical concerns around the world have made US equities the so called ‘cleanest dirty shirt.’ Furthermore, with retail participation in the stock market near its lowest levels on record, there are fewer weak hands in the market vulnerable to triggering fear induced sell offs.
Does this mean that US stock valuations will rise forever? Of course not. It means that we are in the midst of a large but resilient financial bubble. It is difficult to know exactly how this bull market will end. That the Federal Reserve is finally announcing that it wants to reduce its balance sheet and that the ECB wants to taper its QE program are potential risks. However, it is hard to imagine the Federal Reserve or ECB persisting in normalizing policy if that causes an economic shock at home or abroad.
Nonetheless, we have remarked about several large debt bubbles that pose serious threats to the global economy: Chinese private sector debt, dollar denominated emerging market debt, and global sovereign debt.
Perhaps it will simply be the complexity of fending off so many divergent potential financial crises while central bank policy flexibility remains limited, that will result in policy miscalculations. Time will tell.
In the meantime, so long as liquidity injections continue and an acute crisis is averted, it is likely to be business as usual.
P.S. We have added email distribution for The Sounding Line. If you would like to be updated via email when we post a new article, please click here. It’s free and we won’t send any promotional material.
Would you like to be notified when we publish a new article on The Sounding Line? Click here to subscribe for free.


One could easily argue that the historical ratio of GDP to market cap is not relevant in a Zirp world: You have to pay double the price for the same earnings stream. It is not only Central Bank liquidity helping a hand. Corporations are borrowing cheaply (low interest) only to buy back their own stock (bidding up prices for the income). Because of the increasingly strong concentration of wealth, the returns to those investments are not being consumed or invested, but are redeployed to bid up the price of stocks some more. All of this will continue regardless the valuations… Read more »
All good points. To those that argue that the historical ratio is no longer relevant, I would say that ZIRP is unlikely to last forever. When it goes, there may very well be mean reversion in market cap/GDP.
Do it now