Submitted by Taps Coogan on the 31st of December 2018 to The Sounding Line.
Enjoy The Sounding Line? Click here to subscribe for free.
With 322 posts and over 5,000 Top News Stories submitted since the start of the year, 2018 is wrapping up here at The Sounding Line. It has been a pleasure writing and curating news for you this year. Thank you for your readership. If you would like to be updated via email when we post a new article, please click here. It’s free and we won’t send any promotional materials.
Looking back on this year, in no particular order, here are my favorite charts:
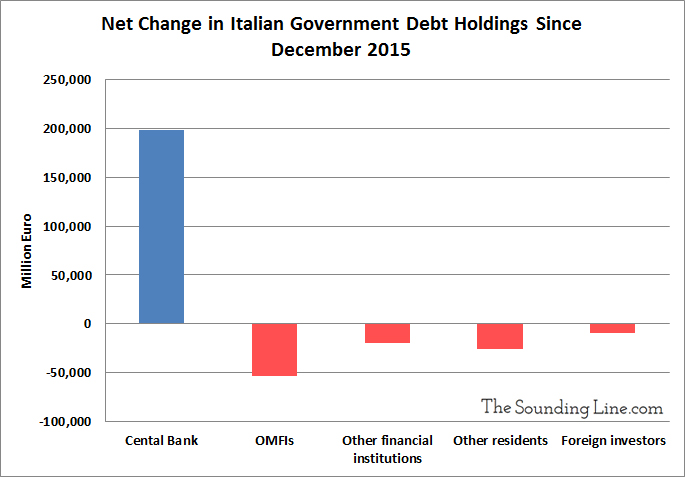
1.) The ECB has become the largest net buyer of Italian government bonds since the Euro was created and the only major net buyer since 2015. Who will buy if the ECB stops?
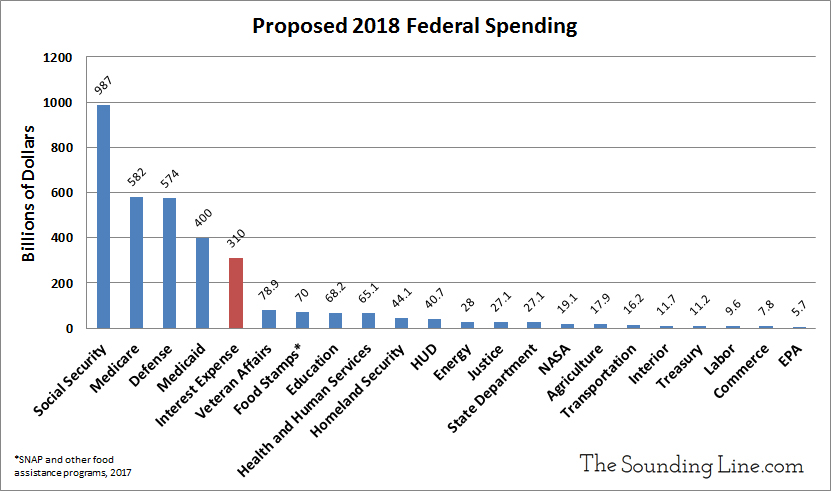
2.) The US federal government will have spent more on interest on the national debt this year than the combined amount spent on Food Stamps plus the departments of: Homeland Security, Housing and Human Development, Energy, Justice, the State Department, NASA, Agriculture, Transportation, the Interior, and the EPA. The interest expense will be even higher in 2019.
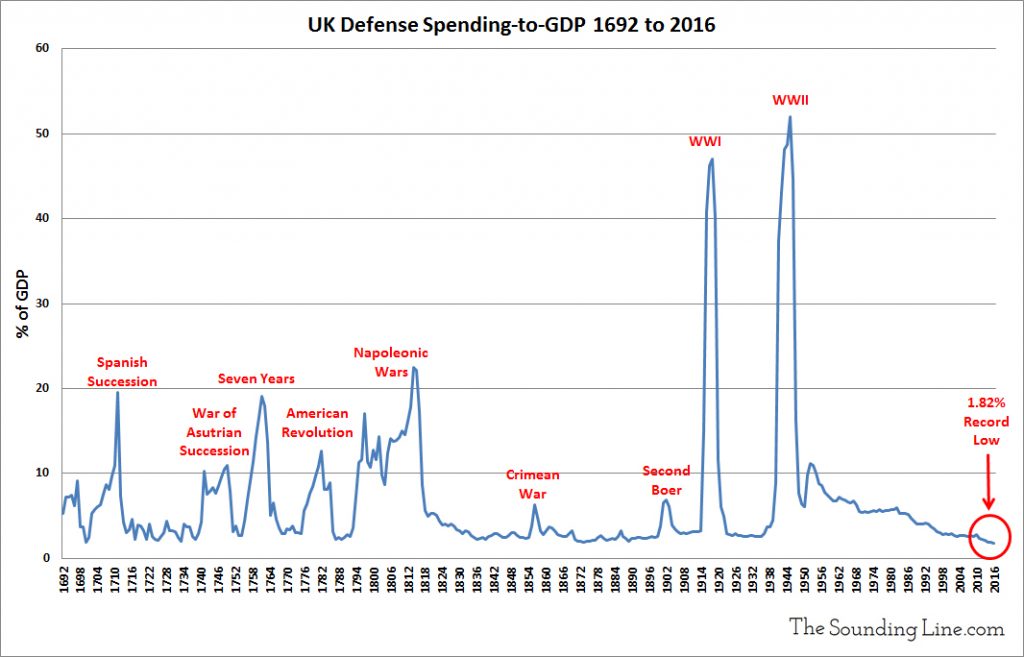
3.) UK defense spending recently hit its lowest level relative to the economy since 1692. Keep in mind that the UK spends more on its military than any other European country except for Russia.
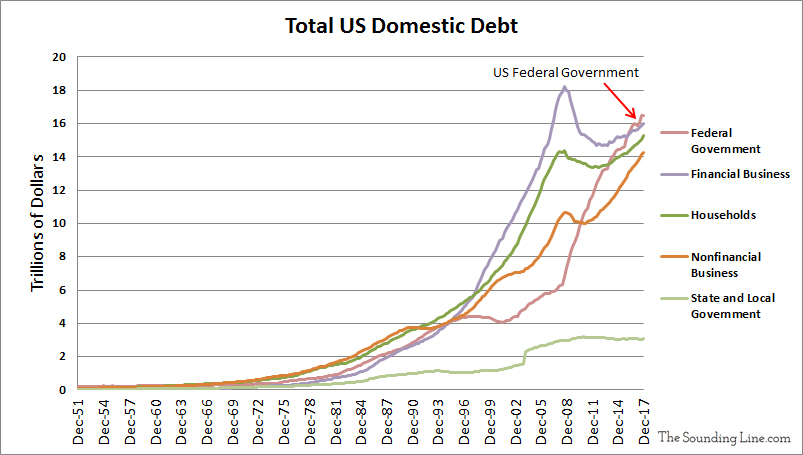
4.) The US Federal Government has overtaken the entire financial sector to become the largest borrower in the US economy, even when excluding $5 trillion of intragovernment debt that the government owes to itself.
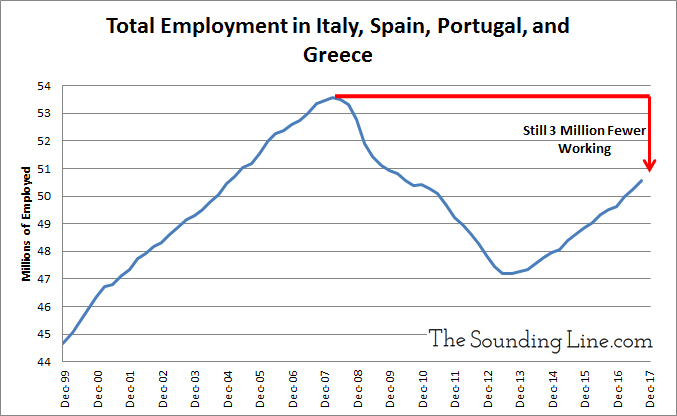
5.) Southern Europe has not seen net job creation in over a decade despite its population growing by over three million people since then.
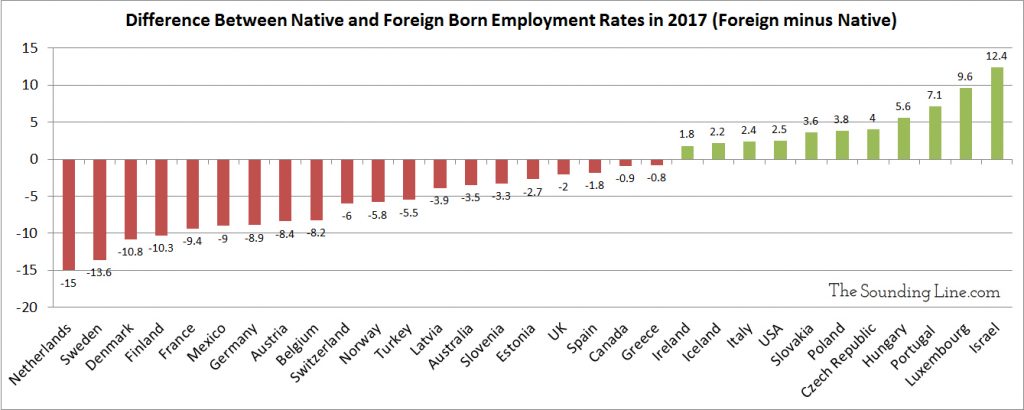
6.) The employment rate among foreign born residents is as much as 15% lower than the native born population in Western European countries. Integration doesn’t seem to be working well.
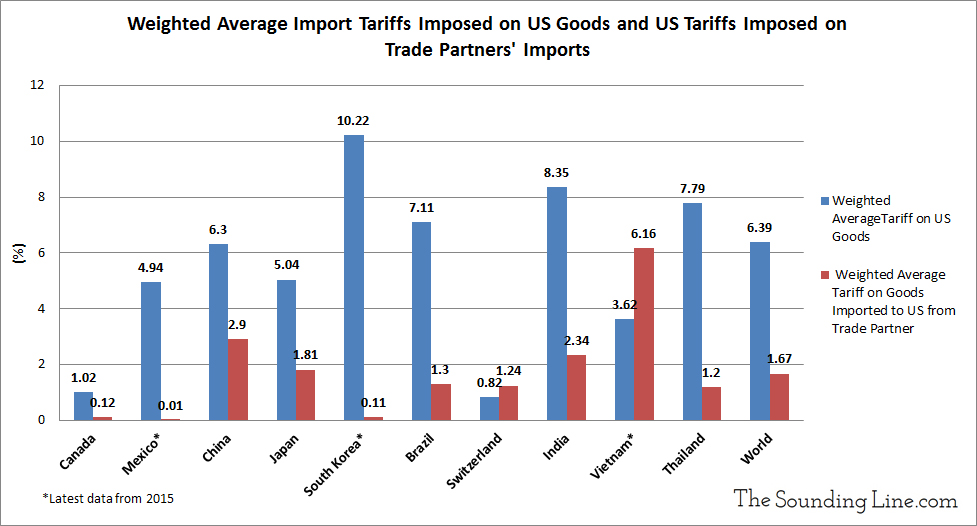
7.) Nearly all of the US’s major trading partners impose higher tariffs on the US than vice versa. How did that come to pass?
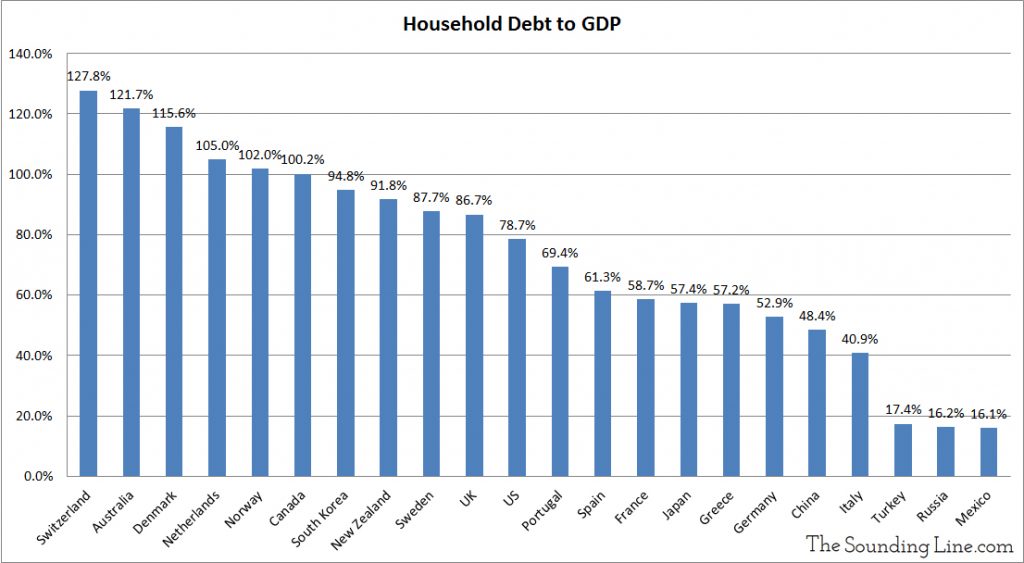
8.) Swiss households are now the most indebted in the world. Australia is not far behind. Their debt levels are over 20% higher than the US at the peak of the housing bubble.
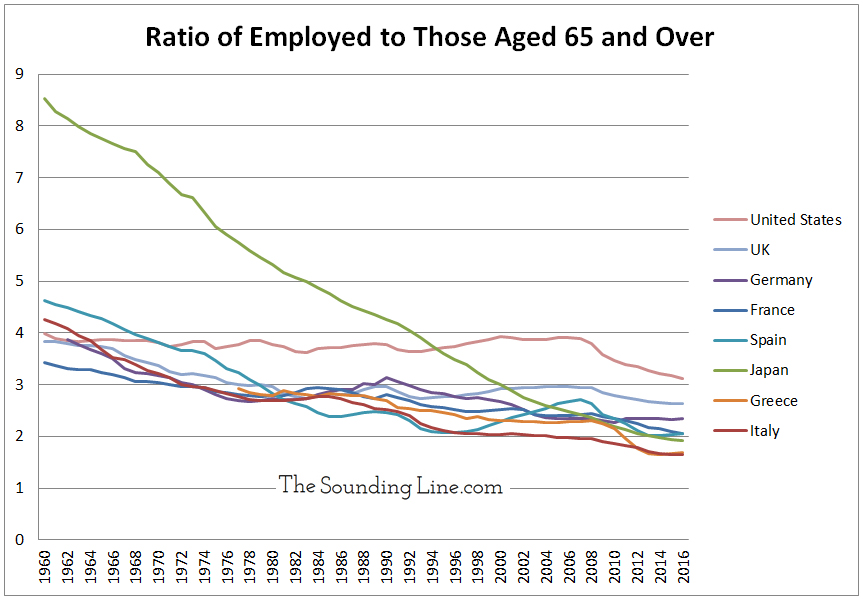
9.) There are now barely two workers per senior in most developed economies.
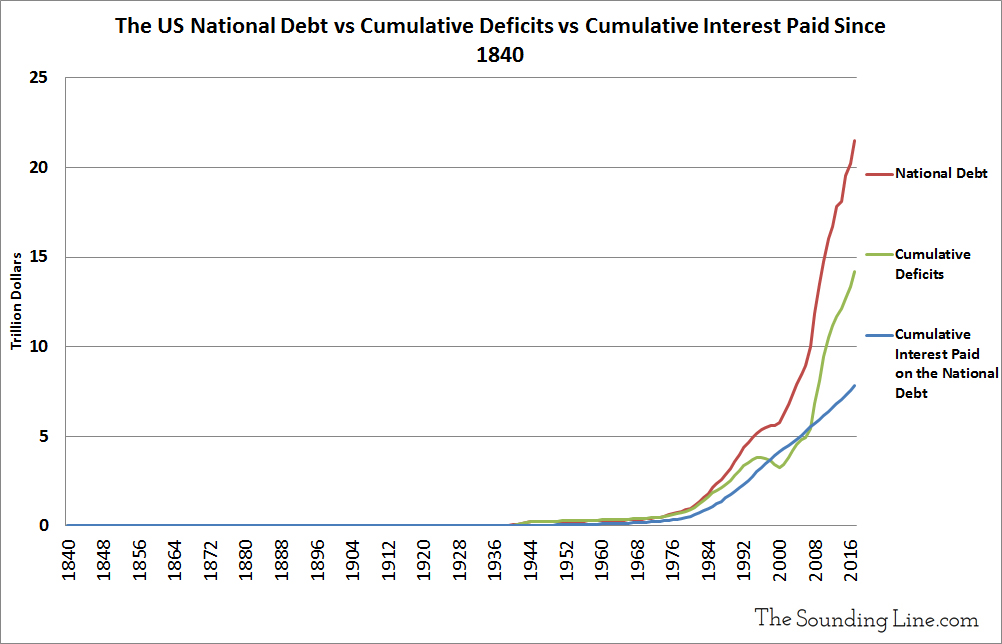
10.) Since the US national debt was last eliminated in 1840, the US has paid a cumulative $7.8 trillion of interest and principal on the national debt. Simple arithmetic reveals that 55% the $14.2 trillion in deficit spending since 1840 has, in effect, gone towards servicing and repaying the national debt. Only 45% went to actual programs. Put differently, instead of paying down its debt with tax revenue, the federal government has essentially rolled over 55% of its debt since 1840 with new debt. All of the budget surpluses combined in the last 179 years amount to $580 billion, less than the deficit in 2017 alone ($665 billion).
11.) Via Crescast Capital, China is probably in the midst of the largest financial bubble in modern history. Can it survive another year amid slumping growth?

Happy News Years and best of luck in 2019.
-Taps Coogan
P.S. If you would like to be updated via email when we post a new article, please click here. It’s free and we won’t send any promotional materials.
Would you like to be notified when we publish a new article on The Sounding Line? Click here to subscribe for free.


Magnificent charts, they speak volumes as to how we have gotten to where we are today! The last two should scare all of us.
The first chart showing the ECB buying Italian debt should also cause us to pause. Thanks again, and may 2019 be kind to you and all of yours.